Midland County, Texas Nativity & Citizenship Status (2024)
Place of birth and citizenship status analysis for Midland County, Texas
Midland County, Texas Nativity & Citizenship Indicators (2024)
Native Born
87.2%
Foreign Born
12.8%
Naturalized
5.6%
US Citizens
92.8%
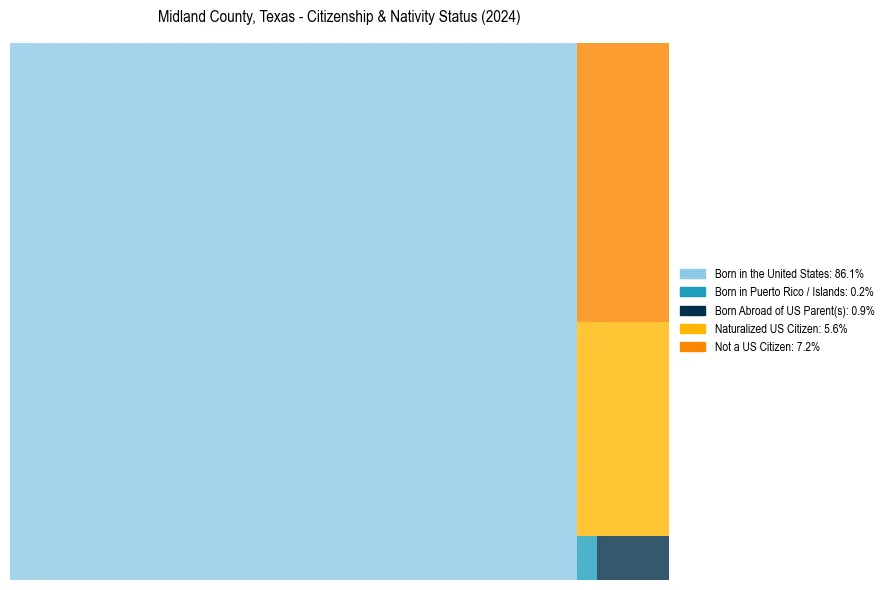
Midland County, Texas Nativity & Citizenship Distribution
Midland County, Texas Historical Nativity Trends (2010–2024)
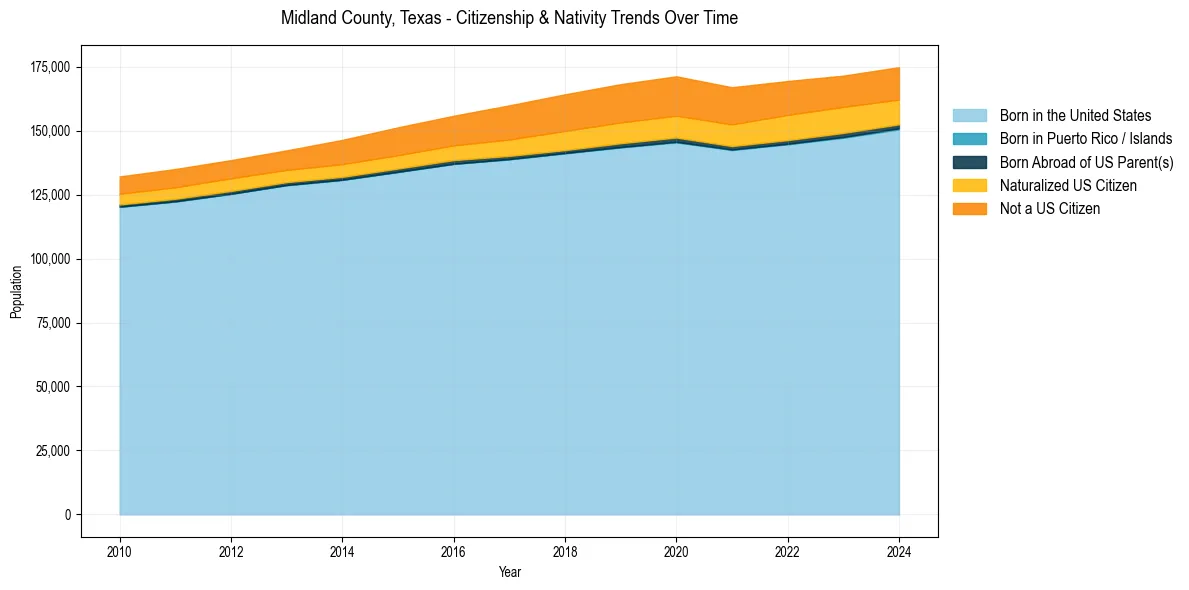
Midland County, Texas Population & Nativity History
| Year | Total Pop | Foreign Born | Native Born |
|---|---|---|---|
| 2024 | 174,801 | 12.8% | 87.2% |
| 2023 | 171,496 | 13.1% | 86.9% |
| 2022 | 169,393 | 13.6% | 86.4% |
| 2021 | 166,964 | 13.8% | 86.2% |
| 2020 | 171,238 | 14.0% | 86.0% |
| 2019 | 168,167 | 13.7% | 86.3% |
| 2018 | 164,194 | 13.3% | 86.7% |
| 2017 | 159,883 | 12.4% | 87.6% |
| 2016 | 155,817 | 11.1% | 88.9% |
| 2015 | 151,290 | 10.6% | 89.4% |
| 2014 | 146,387 | 9.9% | 90.1% |
| 2013 | 142,289 | 8.7% | 91.3% |
| 2012 | 138,472 | 8.7% | 91.3% |
| 2011 | 135,002 | 8.6% | 91.4% |
| 2010 | 132,103 | 8.3% | 91.7% |
Nativity & Citizenship FAQs for Midland County, Texas
Approximately 12.8% of residents in Midland County, Texas were born outside the United States.
The vast majority of residents, roughly 92.8%, are U.S. citizens (including both native-born and naturalized citizens).