McLennan County, Texas Nativity & Citizenship Status (2024)
Place of birth and citizenship status analysis for McLennan County, Texas
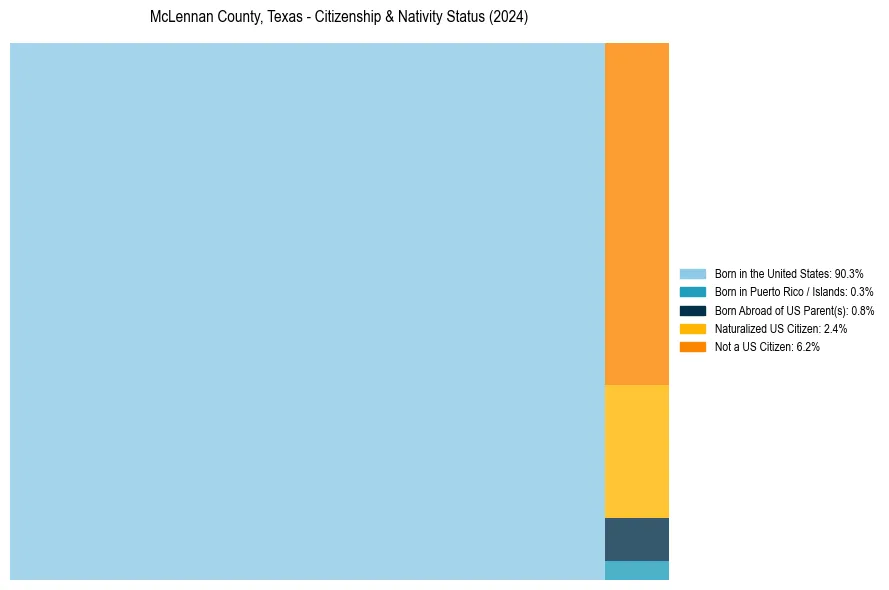
McLennan County, Texas Nativity & Citizenship Indicators (2024)
Native Born
91.4%
Foreign Born
8.6%
Naturalized
2.4%
US Citizens
93.8%
McLennan County, Texas Nativity & Citizenship Distribution
McLennan County, Texas Historical Nativity Trends (2010–2024)
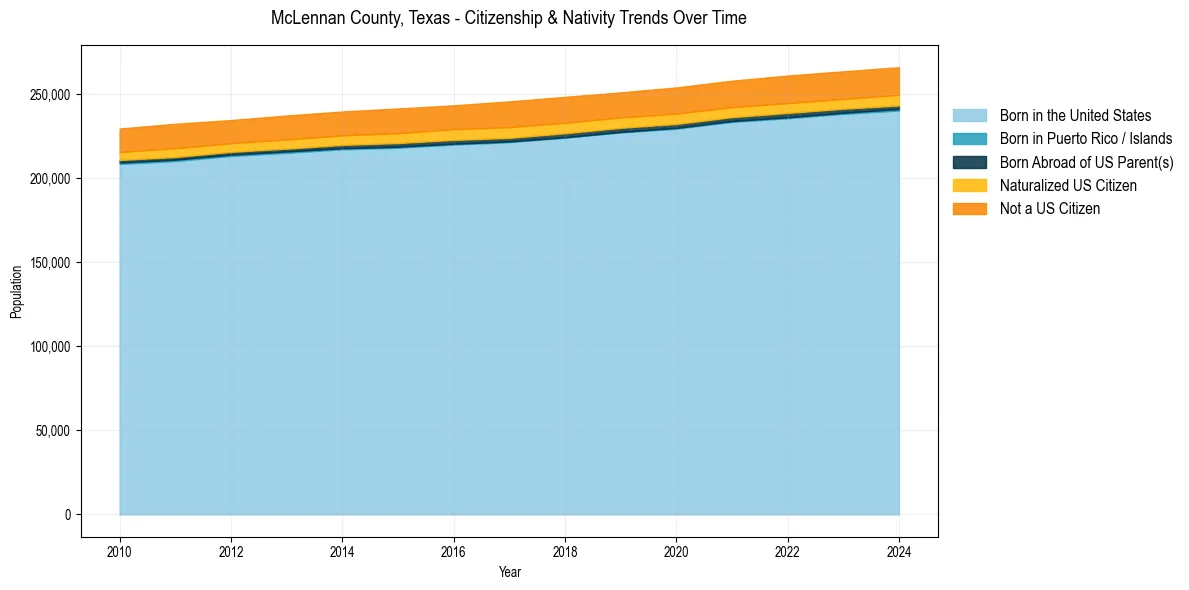
McLennan County, Texas Population & Nativity History
| Year | Total Pop | Foreign Born | Native Born |
|---|---|---|---|
| 2024 | 266,067 | 8.6% | 91.4% |
| 2023 | 263,608 | 8.5% | 91.5% |
| 2022 | 261,090 | 8.5% | 91.5% |
| 2021 | 258,031 | 8.4% | 91.6% |
| 2020 | 254,045 | 8.6% | 91.4% |
| 2019 | 251,089 | 8.4% | 91.6% |
| 2018 | 248,429 | 8.7% | 91.3% |
| 2017 | 245,720 | 8.8% | 91.2% |
| 2016 | 243,394 | 8.5% | 91.5% |
| 2015 | 241,505 | 8.5% | 91.5% |
| 2014 | 239,717 | 8.3% | 91.7% |
| 2013 | 237,316 | 8.3% | 91.7% |
| 2012 | 234,626 | 8.1% | 91.9% |
| 2011 | 232,396 | 8.5% | 91.5% |
| 2010 | 229,587 | 8.2% | 91.8% |
Nativity & Citizenship FAQs for McLennan County, Texas
Approximately 8.6% of residents in McLennan County, Texas were born outside the United States.
The vast majority of residents, roughly 93.8%, are U.S. citizens (including both native-born and naturalized citizens).