Lubbock County, Texas Nativity & Citizenship Status (2024)
Place of birth and citizenship status analysis for Lubbock County, Texas
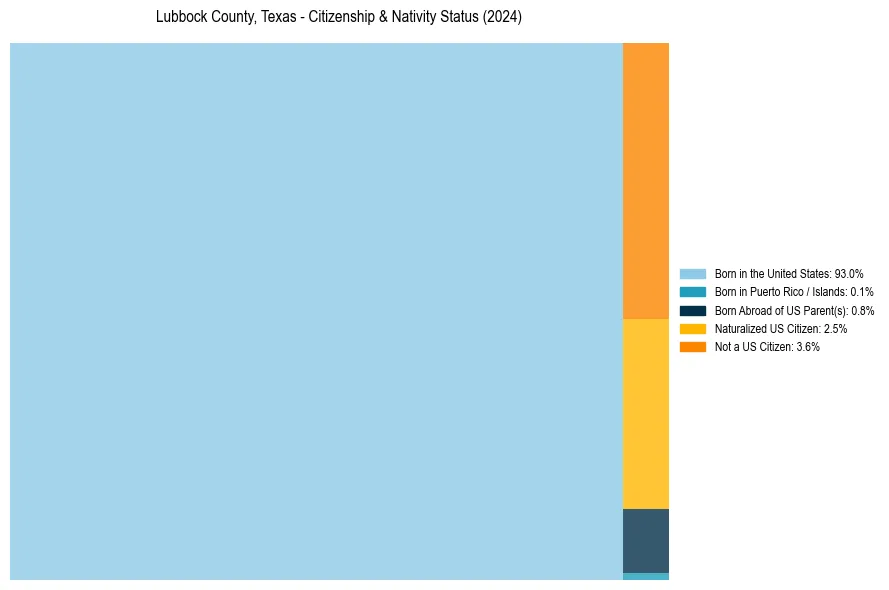
Lubbock County, Texas Nativity & Citizenship Indicators (2024)
Native Born
93.9%
Foreign Born
6.1%
Naturalized
2.5%
US Citizens
96.4%
Lubbock County, Texas Nativity & Citizenship Distribution
Lubbock County, Texas Historical Nativity Trends (2010–2024)
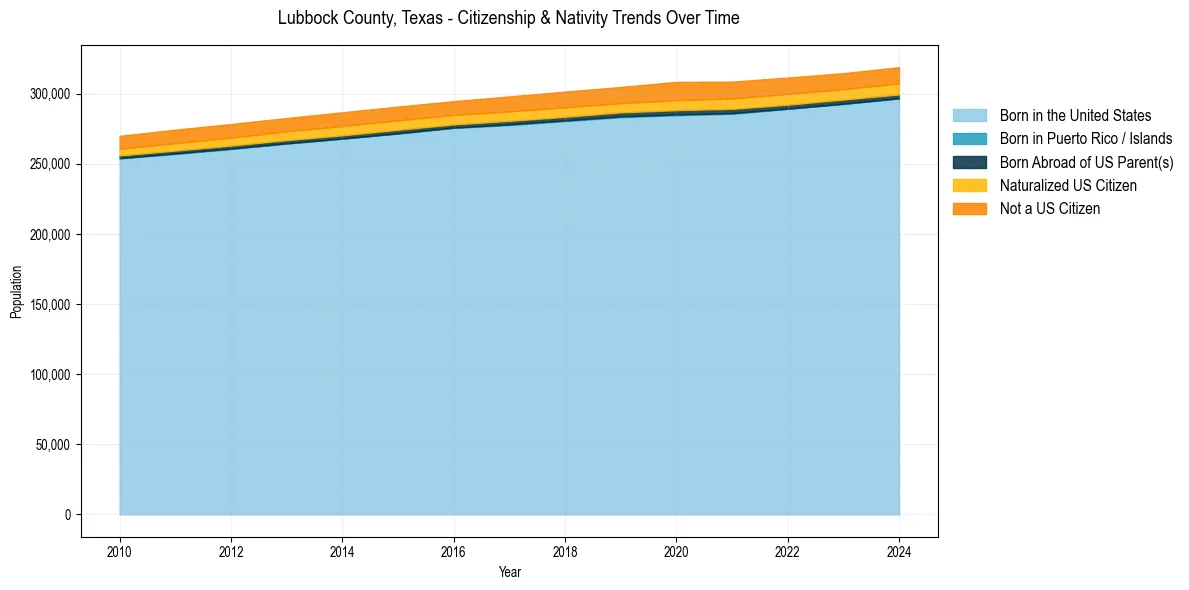
Lubbock County, Texas Population & Nativity History
| Year | Total Pop | Foreign Born | Native Born |
|---|---|---|---|
| 2024 | 318,884 | 6.1% | 93.9% |
| 2023 | 314,633 | 6.0% | 94.0% |
| 2022 | 311,509 | 6.2% | 93.8% |
| 2021 | 308,580 | 6.3% | 93.7% |
| 2020 | 308,392 | 6.5% | 93.5% |
| 2019 | 304,808 | 5.9% | 94.1% |
| 2018 | 301,454 | 6.0% | 94.0% |
| 2017 | 298,042 | 5.8% | 94.2% |
| 2016 | 294,682 | 5.6% | 94.4% |
| 2015 | 290,782 | 5.7% | 94.3% |
| 2014 | 286,747 | 5.7% | 94.3% |
| 2013 | 282,633 | 5.6% | 94.4% |
| 2012 | 278,339 | 5.5% | 94.5% |
| 2011 | 274,359 | 5.5% | 94.5% |
| 2010 | 269,932 | 5.2% | 94.8% |
Nativity & Citizenship FAQs for Lubbock County, Texas
Approximately 6.1% of residents in Lubbock County, Texas were born outside the United States.
The vast majority of residents, roughly 96.4%, are U.S. citizens (including both native-born and naturalized citizens).