Liberty County, Texas Nativity & Citizenship Status (2024)
Place of birth and citizenship status analysis for Liberty County, Texas
Liberty County, Texas Nativity & Citizenship Indicators (2024)
Native Born
84.4%
Foreign Born
15.6%
Naturalized
3.3%
US Citizens
87.7%
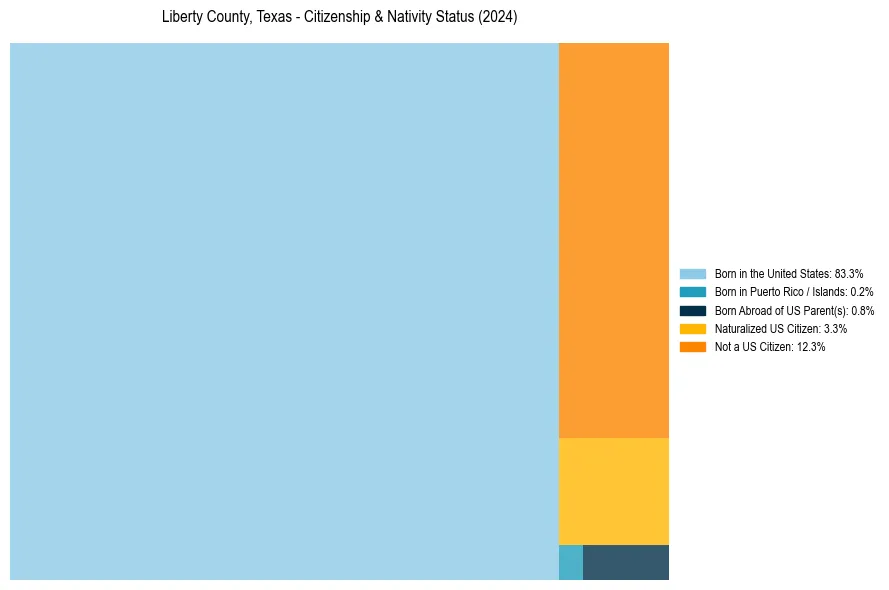
Liberty County, Texas Nativity & Citizenship Distribution
Liberty County, Texas Historical Nativity Trends (2010–2024)
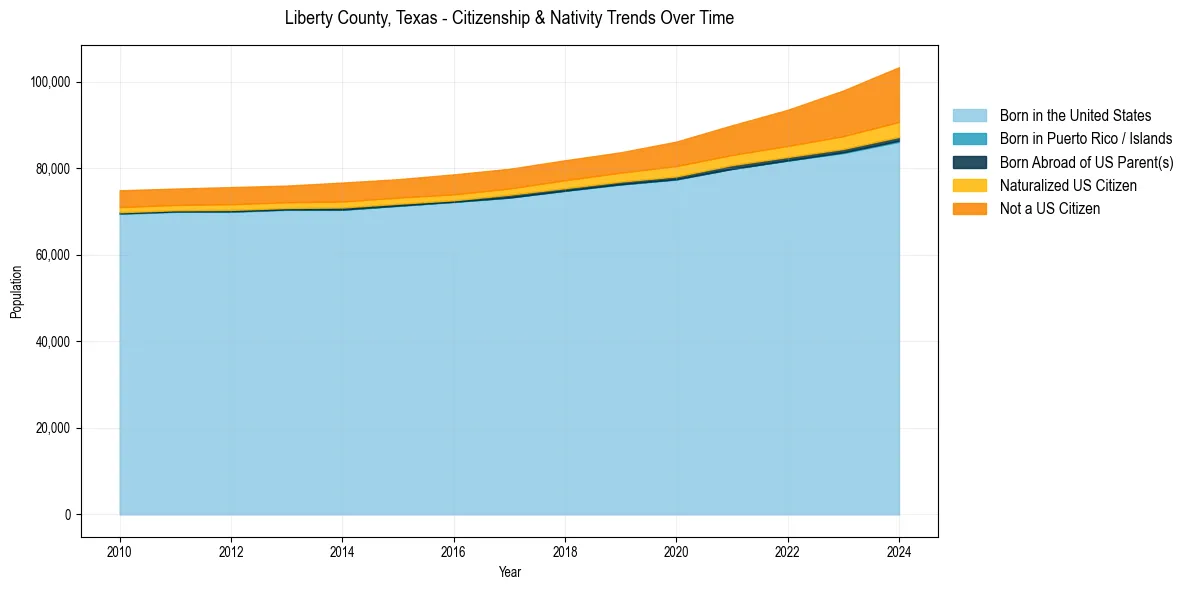
Liberty County, Texas Population & Nativity History
| Year | Total Pop | Foreign Born | Native Born |
|---|---|---|---|
| 2024 | 103,380 | 15.6% | 84.4% |
| 2023 | 97,993 | 13.8% | 86.2% |
| 2022 | 93,523 | 11.7% | 88.3% |
| 2021 | 89,948 | 10.2% | 89.8% |
| 2020 | 86,173 | 9.3% | 90.7% |
| 2019 | 83,702 | 8.1% | 91.9% |
| 2018 | 81,862 | 7.9% | 92.1% |
| 2017 | 79,884 | 7.5% | 92.5% |
| 2016 | 78,598 | 7.6% | 92.4% |
| 2015 | 77,486 | 7.3% | 92.7% |
| 2014 | 76,707 | 7.5% | 92.5% |
| 2013 | 76,013 | 6.8% | 93.2% |
| 2012 | 75,662 | 7.0% | 93.0% |
| 2011 | 75,317 | 6.6% | 93.4% |
| 2010 | 74,922 | 6.8% | 93.2% |
Nativity & Citizenship FAQs for Liberty County, Texas
Approximately 15.6% of residents in Liberty County, Texas were born outside the United States.
The vast majority of residents, roughly 87.7%, are U.S. citizens (including both native-born and naturalized citizens).