Johnson County, Texas Nativity & Citizenship Status (2024)
Place of birth and citizenship status analysis for Johnson County, Texas
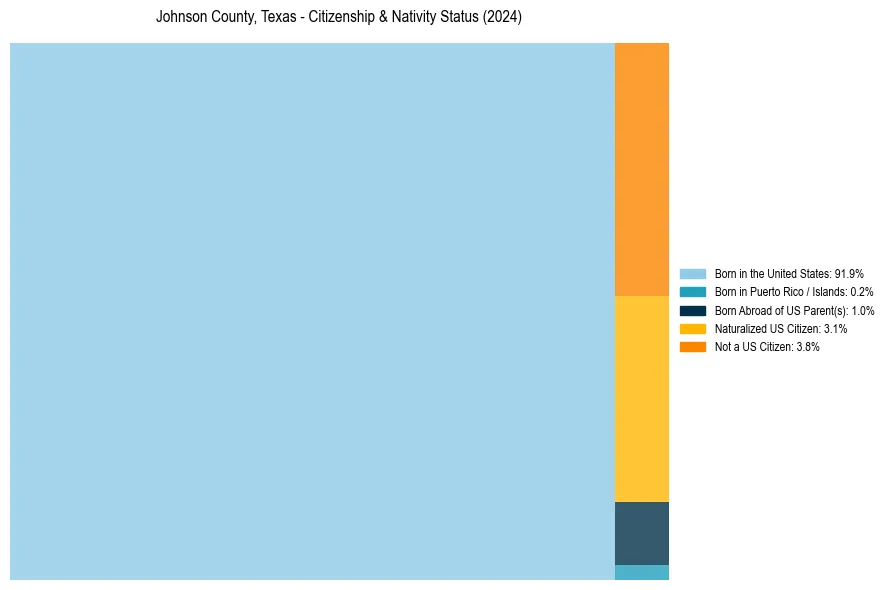
Johnson County, Texas Nativity & Citizenship Indicators (2024)
Native Born
93.1%
Foreign Born
6.9%
Naturalized
3.1%
US Citizens
96.2%
Johnson County, Texas Nativity & Citizenship Distribution
Johnson County, Texas Historical Nativity Trends (2010–2024)
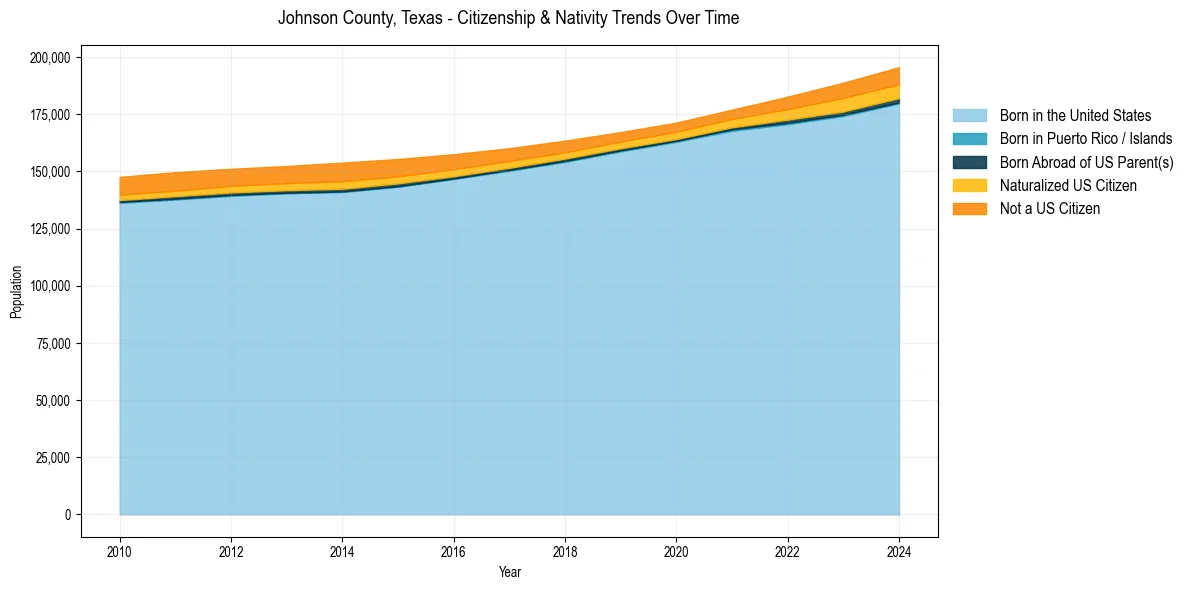
Johnson County, Texas Population & Nativity History
| Year | Total Pop | Foreign Born | Native Born |
|---|---|---|---|
| 2024 | 195,597 | 6.9% | 93.1% |
| 2023 | 188,820 | 6.7% | 93.3% |
| 2022 | 182,690 | 5.5% | 94.5% |
| 2021 | 177,022 | 4.4% | 95.6% |
| 2020 | 171,359 | 4.2% | 95.8% |
| 2019 | 167,212 | 4.2% | 95.8% |
| 2018 | 163,475 | 4.8% | 95.2% |
| 2017 | 160,173 | 5.4% | 94.6% |
| 2016 | 157,544 | 6.1% | 93.9% |
| 2015 | 155,450 | 6.9% | 93.1% |
| 2014 | 153,854 | 7.4% | 92.6% |
| 2013 | 152,384 | 7.0% | 93.0% |
| 2012 | 151,174 | 6.9% | 93.1% |
| 2011 | 149,681 | 7.0% | 93.0% |
| 2010 | 147,611 | 6.9% | 93.1% |
Nativity & Citizenship FAQs for Johnson County, Texas
Approximately 6.9% of residents in Johnson County, Texas were born outside the United States.
The vast majority of residents, roughly 96.2%, are U.S. citizens (including both native-born and naturalized citizens).