Jefferson County, Texas Nativity & Citizenship Status (2024)
Place of birth and citizenship status analysis for Jefferson County, Texas
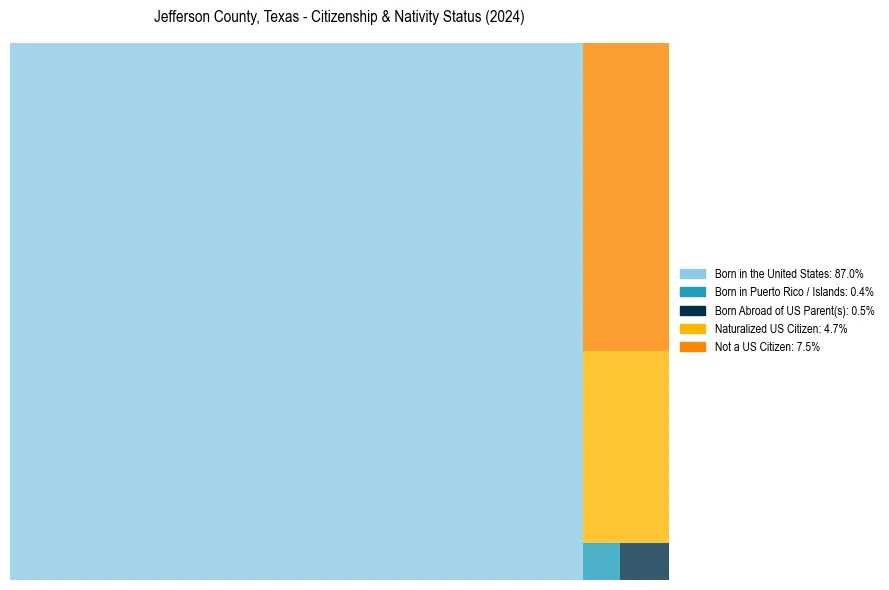
Jefferson County, Texas Nativity & Citizenship Indicators (2024)
Native Born
87.9%
Foreign Born
12.1%
Naturalized
4.7%
US Citizens
92.5%
Jefferson County, Texas Nativity & Citizenship Distribution
Jefferson County, Texas Historical Nativity Trends (2010–2024)
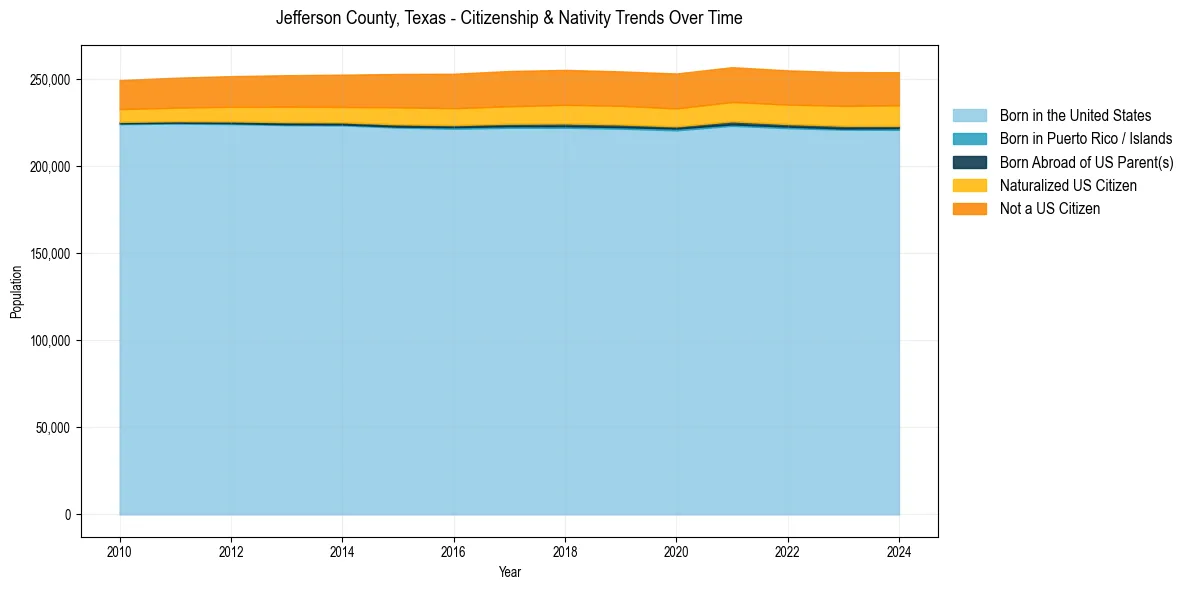
Jefferson County, Texas Population & Nativity History
| Year | Total Pop | Foreign Born | Native Born |
|---|---|---|---|
| 2024 | 253,878 | 12.1% | 87.9% |
| 2023 | 253,939 | 12.2% | 87.8% |
| 2022 | 254,942 | 12.1% | 87.9% |
| 2021 | 256,755 | 12.1% | 87.9% |
| 2020 | 253,136 | 12.0% | 88.0% |
| 2019 | 254,340 | 12.0% | 88.0% |
| 2018 | 255,210 | 12.1% | 87.9% |
| 2017 | 254,574 | 11.9% | 88.1% |
| 2016 | 252,993 | 11.7% | 88.3% |
| 2015 | 252,872 | 11.4% | 88.6% |
| 2014 | 252,466 | 10.8% | 89.2% |
| 2013 | 252,157 | 10.7% | 89.3% |
| 2012 | 251,627 | 10.3% | 89.7% |
| 2011 | 250,714 | 10.0% | 90.0% |
| 2010 | 249,349 | 9.6% | 90.4% |
Nativity & Citizenship FAQs for Jefferson County, Texas
Approximately 12.1% of residents in Jefferson County, Texas were born outside the United States.
The vast majority of residents, roughly 92.5%, are U.S. citizens (including both native-born and naturalized citizens).