Hunt County, Texas Nativity & Citizenship Status (2024)
Place of birth and citizenship status analysis for Hunt County, Texas
Hunt County, Texas Nativity & Citizenship Indicators (2024)
Native Born
91.9%
Foreign Born
8.1%
Naturalized
2.8%
US Citizens
94.7%
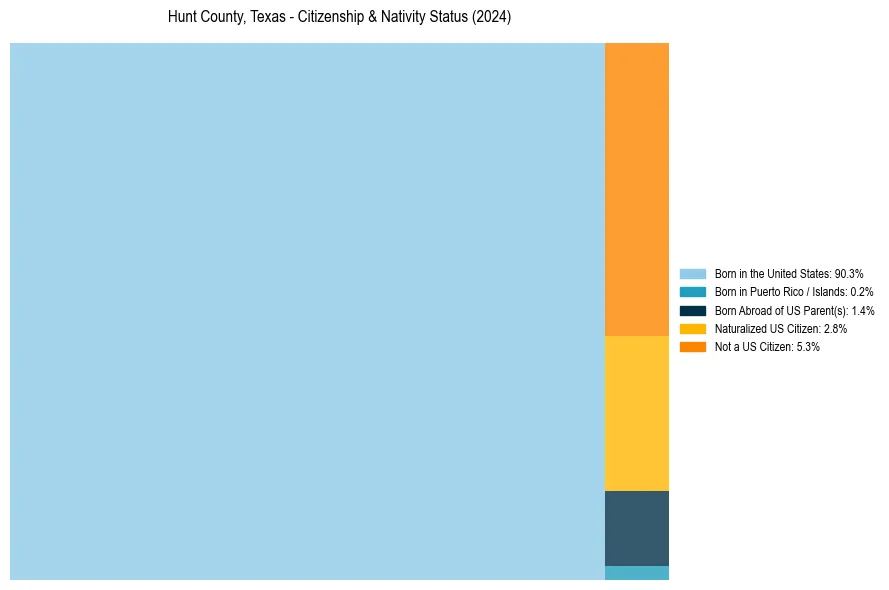
Hunt County, Texas Nativity & Citizenship Distribution
Hunt County, Texas Historical Nativity Trends (2010–2024)
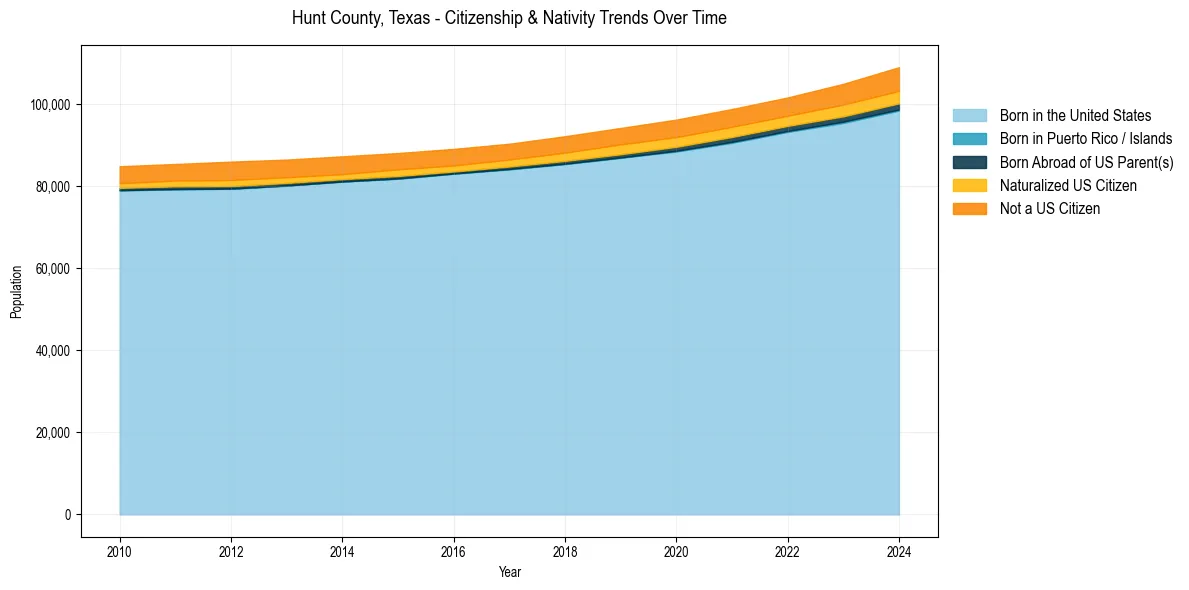
Hunt County, Texas Population & Nativity History
| Year | Total Pop | Foreign Born | Native Born |
|---|---|---|---|
| 2024 | 108,972 | 8.1% | 91.9% |
| 2023 | 104,917 | 7.6% | 92.4% |
| 2022 | 101,596 | 6.8% | 93.2% |
| 2021 | 98,783 | 6.9% | 93.1% |
| 2020 | 96,202 | 6.9% | 93.1% |
| 2019 | 94,162 | 6.8% | 93.2% |
| 2018 | 92,152 | 6.5% | 93.5% |
| 2017 | 90,322 | 6.2% | 93.8% |
| 2016 | 89,068 | 6.2% | 93.8% |
| 2015 | 88,052 | 6.4% | 93.6% |
| 2014 | 87,256 | 6.4% | 93.6% |
| 2013 | 86,455 | 6.6% | 93.4% |
| 2012 | 85,955 | 6.9% | 93.1% |
| 2011 | 85,390 | 6.4% | 93.6% |
| 2010 | 84,836 | 6.2% | 93.8% |
Nativity & Citizenship FAQs for Hunt County, Texas
Approximately 8.1% of residents in Hunt County, Texas were born outside the United States.
The vast majority of residents, roughly 94.7%, are U.S. citizens (including both native-born and naturalized citizens).