Hidalgo County, Texas Nativity & Citizenship Status (2024)
Place of birth and citizenship status analysis for Hidalgo County, Texas
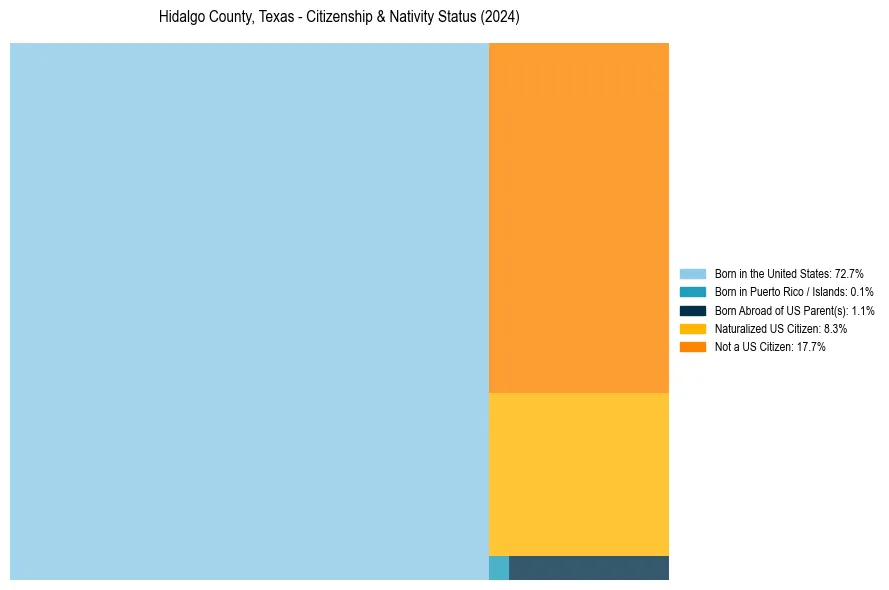
Hidalgo County, Texas Nativity & Citizenship Indicators (2024)
Native Born
73.9%
Foreign Born
26.1%
Naturalized
8.3%
US Citizens
82.3%
Hidalgo County, Texas Nativity & Citizenship Distribution
Hidalgo County, Texas Historical Nativity Trends (2010–2024)
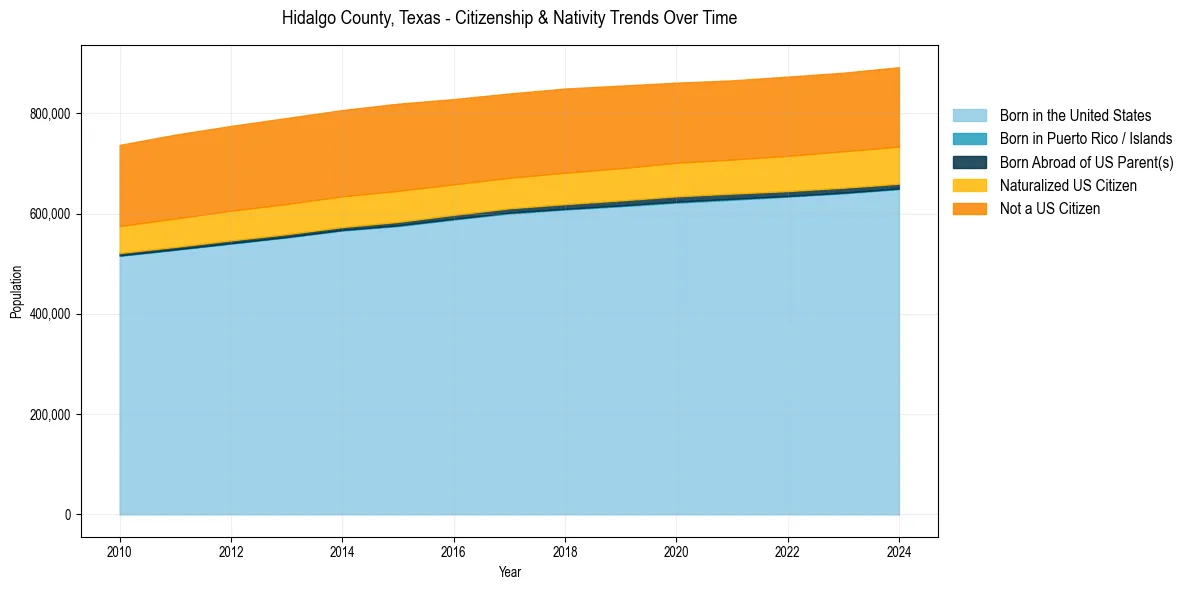
Hidalgo County, Texas Population & Nativity History
| Year | Total Pop | Foreign Born | Native Born |
|---|---|---|---|
| 2024 | 891,977 | 26.1% | 73.9% |
| 2023 | 880,921 | 26.0% | 74.0% |
| 2022 | 873,167 | 26.1% | 73.9% |
| 2021 | 865,677 | 26.1% | 73.9% |
| 2020 | 861,137 | 26.3% | 73.7% |
| 2019 | 855,176 | 26.8% | 73.2% |
| 2018 | 849,389 | 27.1% | 72.9% |
| 2017 | 839,539 | 27.3% | 72.7% |
| 2016 | 828,334 | 27.9% | 72.1% |
| 2015 | 819,217 | 28.8% | 71.2% |
| 2014 | 806,447 | 28.9% | 71.1% |
| 2013 | 790,646 | 29.3% | 70.7% |
| 2012 | 774,820 | 29.5% | 70.5% |
| 2011 | 757,453 | 29.6% | 70.4% |
| 2010 | 736,973 | 29.3% | 70.7% |
Nativity & Citizenship FAQs for Hidalgo County, Texas
Approximately 26.1% of residents in Hidalgo County, Texas were born outside the United States.
The vast majority of residents, roughly 82.3%, are U.S. citizens (including both native-born and naturalized citizens).