Hidalgo County, Texas Health Insurance Coverage (2024)
Detailed analysis of uninsured rates and coverage trends for Hidalgo County, Texas
Universe
884,598
Total Uninsured
249,883
Uninsured Rate
28.2%
Coverage by Age and Gender
Distribution of insured vs. uninsured residents in Hidalgo County, Texas
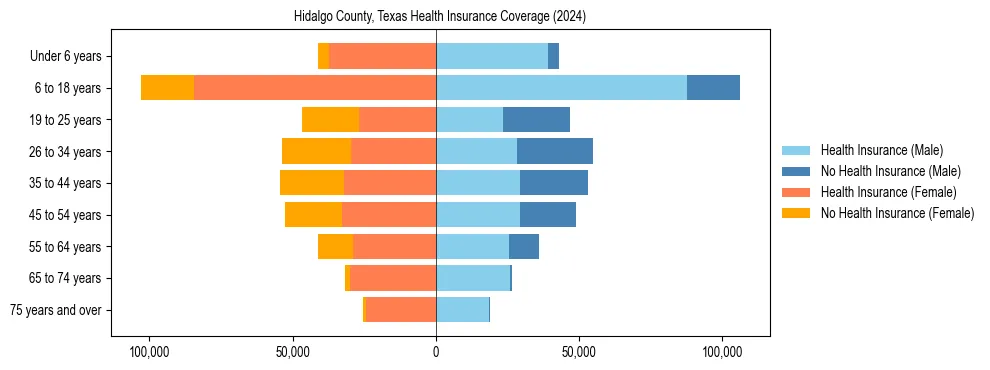
Uninsured Rates by Demographic Group
Under 18 Years
Male Uninsured14.8%
Female Uninsured15.4%
18 to 34 Years
Male Uninsured48.9%
Female Uninsured43.8%
35 to 64 Years
Male Uninsured38.7%
Female Uninsured36.7%
65 Years & Over
Male Uninsured2.5%
Female Uninsured4.9%
Uninsured Rate Trends
Historical coverage data from 2012 to 2024
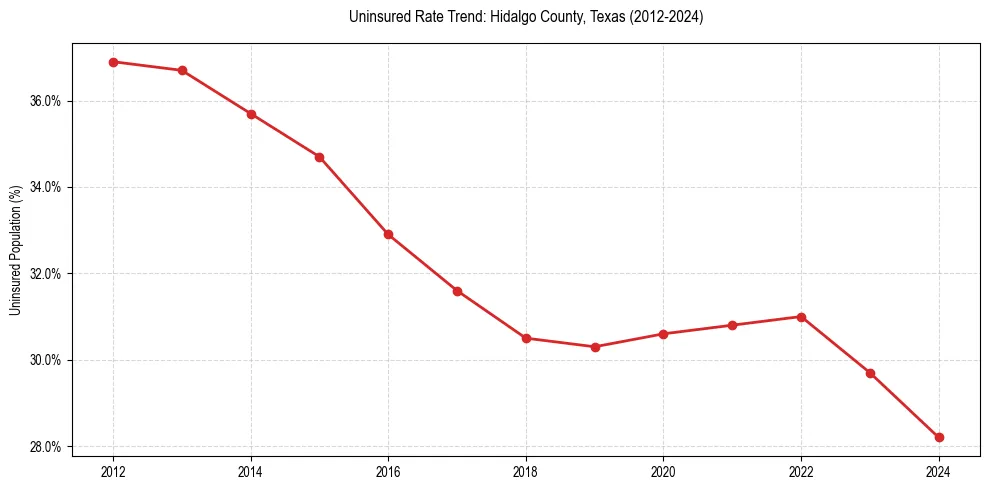
| Year | Total Uninsured | Uninsured Rate |
|---|---|---|
| 2024 | 249,883 | 28.2% |
| 2023 | 259,593 | 29.7% |
| 2022 | 268,045 | 31.0% |
| 2021 | 264,565 | 30.8% |
| 2020 | 260,885 | 30.6% |
| 2019 | 256,883 | 30.3% |
| 2018 | 256,271 | 30.5% |
| 2017 | 262,644 | 31.6% |
| 2016 | 269,989 | 32.9% |
| 2015 | 281,661 | 34.7% |
| 2014 | 285,782 | 35.7% |
| 2013 | 287,846 | 36.7% |
| 2012 | 283,994 | 36.9% |
Frequently Asked Questions
Approximately 28.2% of the population in Hidalgo County, Texas does not have health insurance coverage.
In Hidalgo County, Texas, young adult males (18-34) face the highest barrier to coverage, with an uninsured rate of 48.9%. This is notably higher than the overall local average of 28.2%.