Texas Health Insurance Coverage (2024)
Detailed analysis of uninsured rates and coverage trends for Texas
Universe
29,696,761
Total Uninsured
5,085,788
Uninsured Rate
17.1%
Coverage by Age and Gender
Distribution of insured vs. uninsured residents in Texas
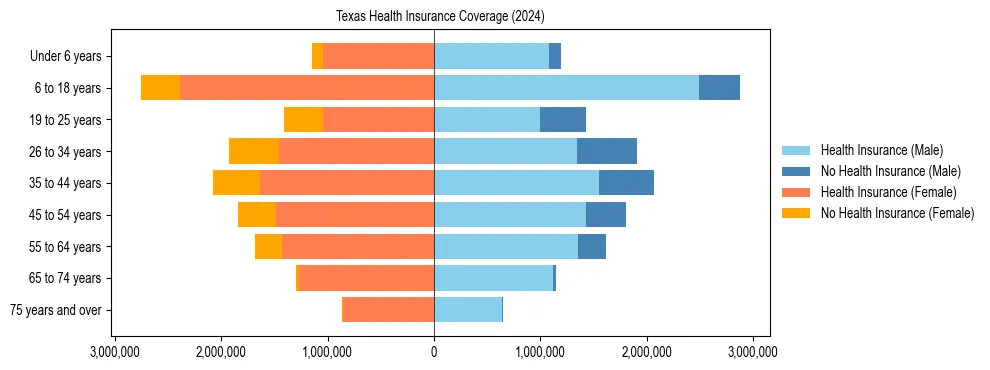
Uninsured Rates by Demographic Group
Under 18 Years
Male Uninsured12.1%
Female Uninsured11.8%
18 to 34 Years
Male Uninsured29.8%
Female Uninsured25.2%
35 to 64 Years
Male Uninsured21.0%
Female Uninsured19.1%
65 Years & Over
Male Uninsured1.8%
Female Uninsured1.9%
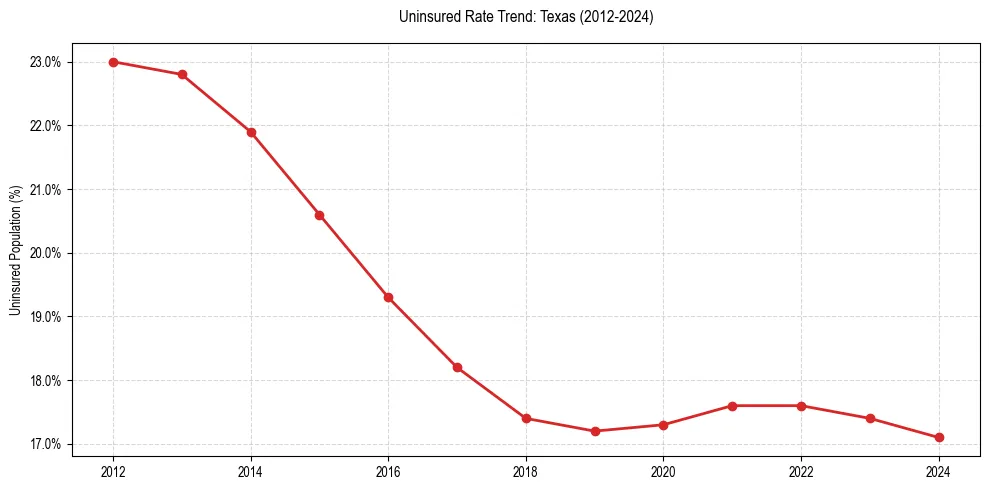
Uninsured Rate Trends
Historical coverage data from 2012 to 2024
| Year | Total Uninsured | Uninsured Rate |
|---|---|---|
| 2024 | 5,085,788 | 17.1% |
| 2023 | 5,061,251 | 17.4% |
| 2022 | 5,056,008 | 17.6% |
| 2021 | 4,995,381 | 17.6% |
| 2020 | 4,877,069 | 17.3% |
| 2019 | 4,791,164 | 17.2% |
| 2018 | 4,764,897 | 17.4% |
| 2017 | 4,916,911 | 18.2% |
| 2016 | 5,114,811 | 19.3% |
| 2015 | 5,363,985 | 20.6% |
| 2014 | 5,610,908 | 21.9% |
| 2013 | 5,746,305 | 22.8% |
| 2012 | 5,696,586 | 23.0% |
Frequently Asked Questions
Approximately 17.1% of the population in Texas does not have health insurance coverage.
In Texas, young adult males (18-34) face the highest barrier to coverage, with an uninsured rate of 29.8%. This is notably higher than the overall local average of 17.1%.