Harris County, Texas Nativity & Citizenship Status (2024)
Place of birth and citizenship status analysis for Harris County, Texas
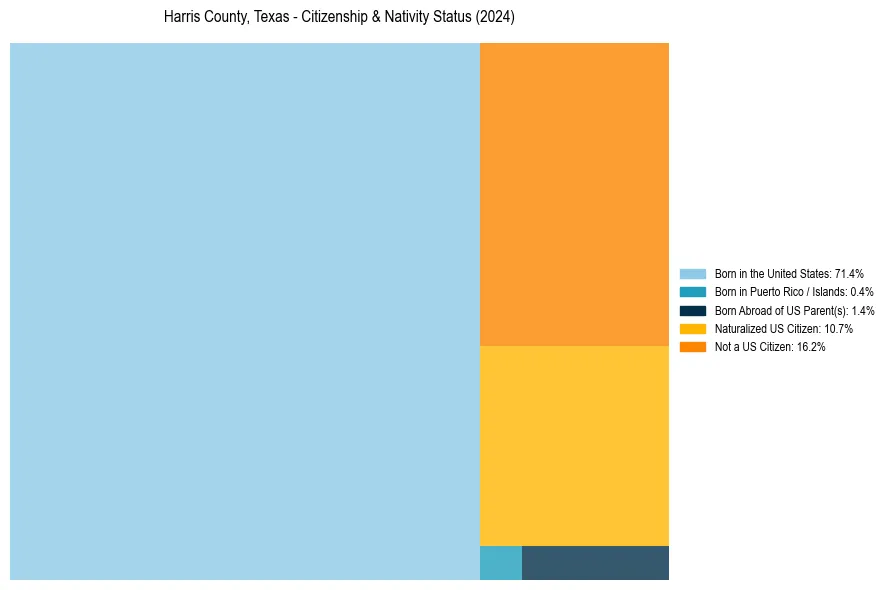
Harris County, Texas Nativity & Citizenship Indicators (2024)
Native Born
73.2%
Foreign Born
26.8%
Naturalized
10.7%
US Citizens
83.8%
Harris County, Texas Nativity & Citizenship Distribution
Harris County, Texas Historical Nativity Trends (2010–2024)
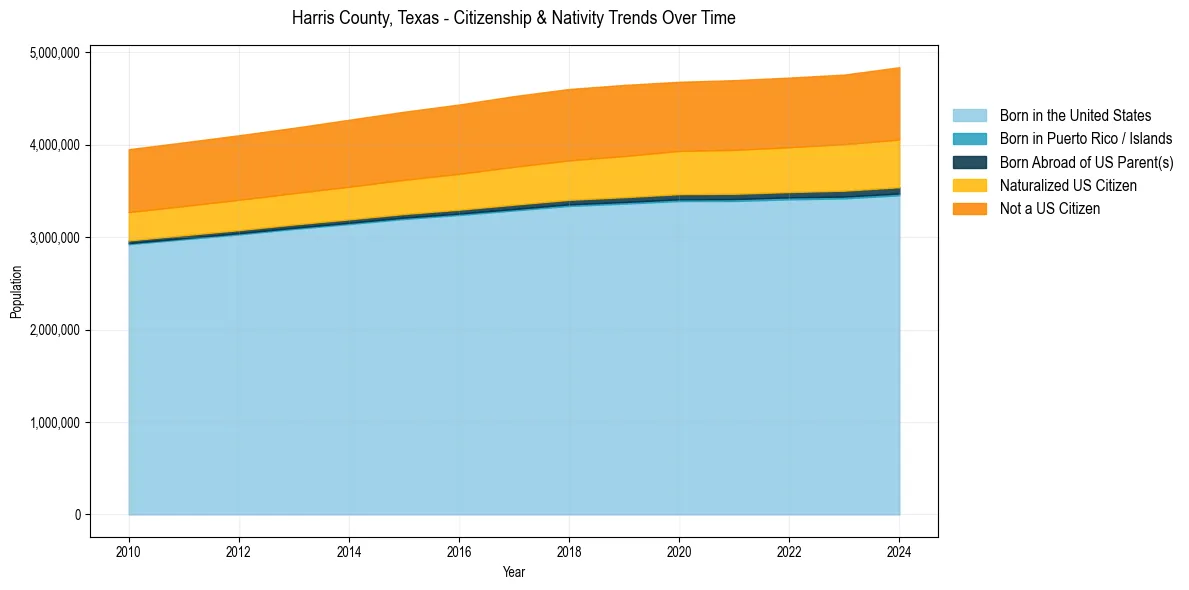
Harris County, Texas Population & Nativity History
| Year | Total Pop | Foreign Born | Native Born |
|---|---|---|---|
| 2024 | 4,838,303 | 26.8% | 73.2% |
| 2023 | 4,758,579 | 26.4% | 73.6% |
| 2022 | 4,726,177 | 26.2% | 73.8% |
| 2021 | 4,697,957 | 26.2% | 73.8% |
| 2020 | 4,680,609 | 26.0% | 74.0% |
| 2019 | 4,646,630 | 26.1% | 73.9% |
| 2018 | 4,602,523 | 26.1% | 73.9% |
| 2017 | 4,525,519 | 26.0% | 74.0% |
| 2016 | 4,434,257 | 25.7% | 74.3% |
| 2015 | 4,356,362 | 25.4% | 74.6% |
| 2014 | 4,269,608 | 25.3% | 74.7% |
| 2013 | 4,182,285 | 25.0% | 75.0% |
| 2012 | 4,101,752 | 25.0% | 75.0% |
| 2011 | 4,025,409 | 25.0% | 75.0% |
| 2010 | 3,950,999 | 25.0% | 75.0% |
Nativity & Citizenship FAQs for Harris County, Texas
Approximately 26.8% of residents in Harris County, Texas were born outside the United States.
The vast majority of residents, roughly 83.8%, are U.S. citizens (including both native-born and naturalized citizens).