Harris County, Texas Health Insurance Coverage (2024)
Detailed analysis of uninsured rates and coverage trends for Harris County, Texas
Universe
4,810,498
Total Uninsured
1,005,342
Uninsured Rate
20.9%
Coverage by Age and Gender
Distribution of insured vs. uninsured residents in Harris County, Texas
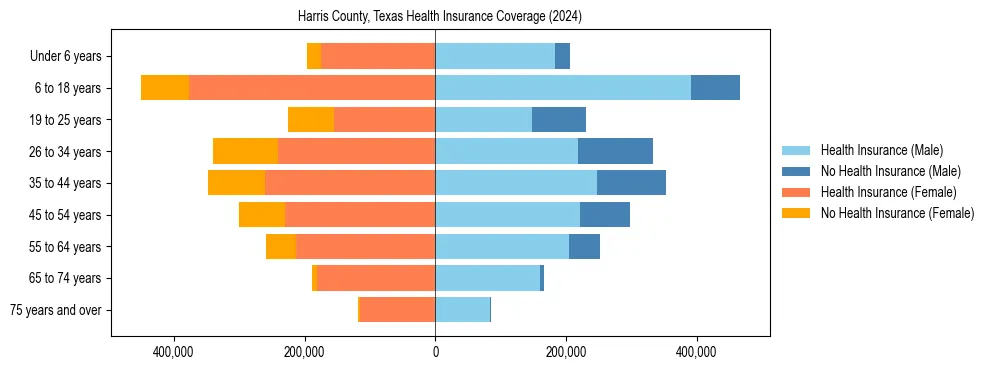
Uninsured Rates by Demographic Group
Under 18 Years
Male Uninsured14.5%
Female Uninsured14.4%
18 to 34 Years
Male Uninsured35.1%
Female Uninsured29.7%
35 to 64 Years
Male Uninsured25.4%
Female Uninsured22.3%
65 Years & Over
Male Uninsured3.4%
Female Uninsured3.3%
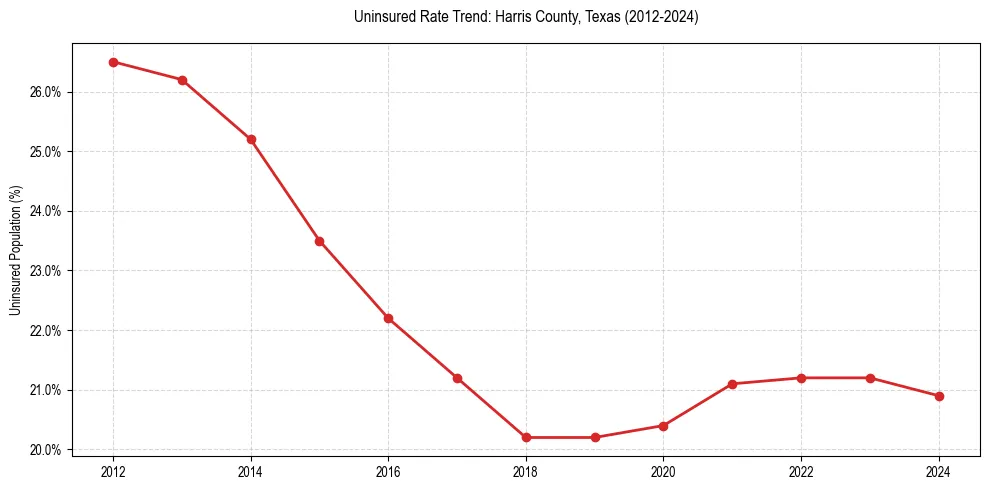
Uninsured Rate Trends
Historical coverage data from 2012 to 2024
| Year | Total Uninsured | Uninsured Rate |
|---|---|---|
| 2024 | 1,005,342 | 20.9% |
| 2023 | 1,001,621 | 21.2% |
| 2022 | 997,287 | 21.2% |
| 2021 | 986,977 | 21.1% |
| 2020 | 951,568 | 20.4% |
| 2019 | 935,083 | 20.2% |
| 2018 | 923,767 | 20.2% |
| 2017 | 952,612 | 21.2% |
| 2016 | 978,821 | 22.2% |
| 2015 | 1,020,251 | 23.5% |
| 2014 | 1,071,534 | 25.2% |
| 2013 | 1,091,895 | 26.2% |
| 2012 | 1,079,569 | 26.5% |
Frequently Asked Questions
Approximately 20.9% of the population in Harris County, Texas does not have health insurance coverage.
In Harris County, Texas, young adult males (18-34) face the highest barrier to coverage, with an uninsured rate of 35.1%. This is notably higher than the overall local average of 20.9%.