Guadalupe County, Texas Nativity & Citizenship Status (2024)
Place of birth and citizenship status analysis for Guadalupe County, Texas
Guadalupe County, Texas Nativity & Citizenship Indicators (2024)
Native Born
92.5%
Foreign Born
7.5%
Naturalized
3.6%
US Citizens
96.1%
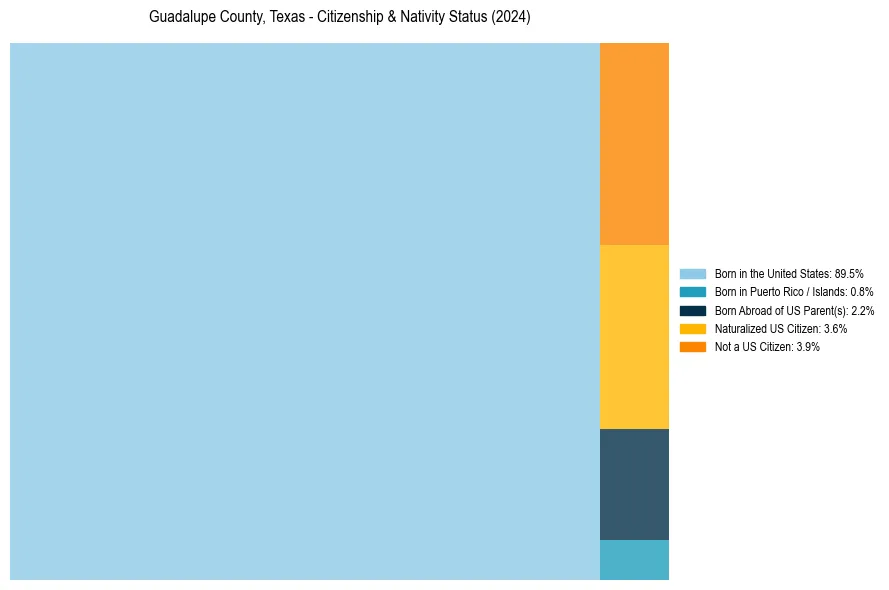
Guadalupe County, Texas Nativity & Citizenship Distribution
Guadalupe County, Texas Historical Nativity Trends (2010–2024)
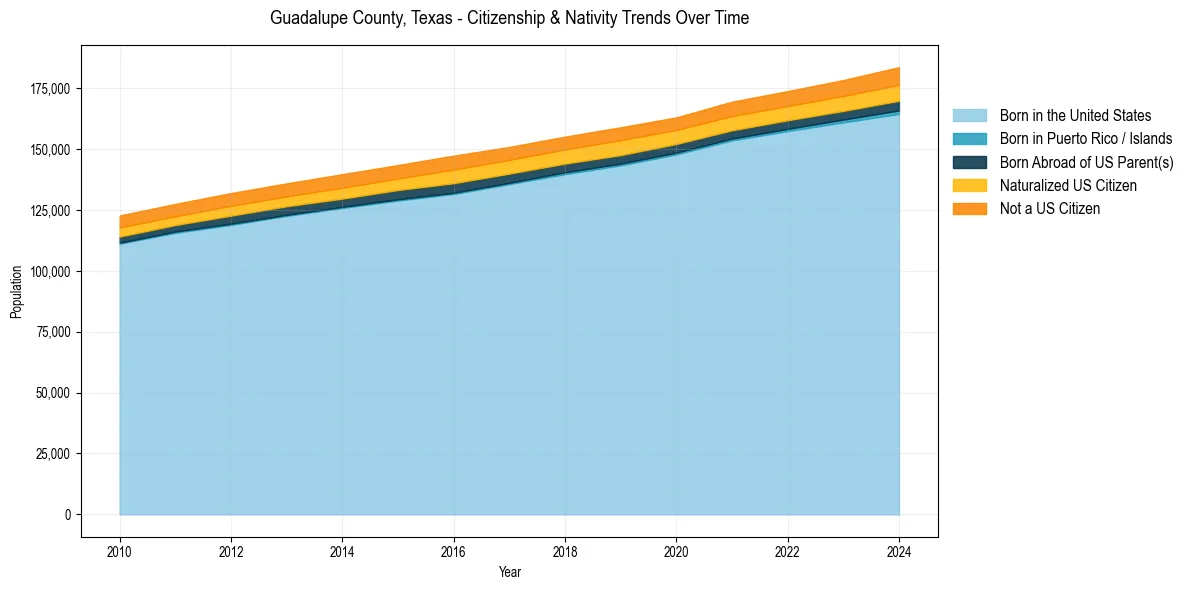
Guadalupe County, Texas Population & Nativity History
| Year | Total Pop | Foreign Born | Native Born |
|---|---|---|---|
| 2024 | 183,642 | 7.5% | 92.5% |
| 2023 | 178,368 | 7.1% | 92.9% |
| 2022 | 173,828 | 6.9% | 93.1% |
| 2021 | 169,477 | 6.9% | 93.1% |
| 2020 | 163,030 | 6.7% | 93.3% |
| 2019 | 158,966 | 7.2% | 92.8% |
| 2018 | 155,137 | 7.1% | 92.9% |
| 2017 | 150,889 | 7.3% | 92.7% |
| 2016 | 147,313 | 7.7% | 92.3% |
| 2015 | 143,460 | 7.1% | 92.9% |
| 2014 | 139,709 | 7.2% | 92.8% |
| 2013 | 135,940 | 6.9% | 93.1% |
| 2012 | 131,945 | 7.0% | 93.0% |
| 2011 | 127,499 | 6.8% | 93.2% |
| 2010 | 122,728 | 7.1% | 92.9% |
Nativity & Citizenship FAQs for Guadalupe County, Texas
Approximately 7.5% of residents in Guadalupe County, Texas were born outside the United States.
The vast majority of residents, roughly 96.1%, are U.S. citizens (including both native-born and naturalized citizens).