Gregg County, Texas Nativity & Citizenship Status (2024)
Place of birth and citizenship status analysis for Gregg County, Texas
Gregg County, Texas Nativity & Citizenship Indicators (2024)
Native Born
91.8%
Foreign Born
8.2%
Naturalized
2.6%
US Citizens
94.4%
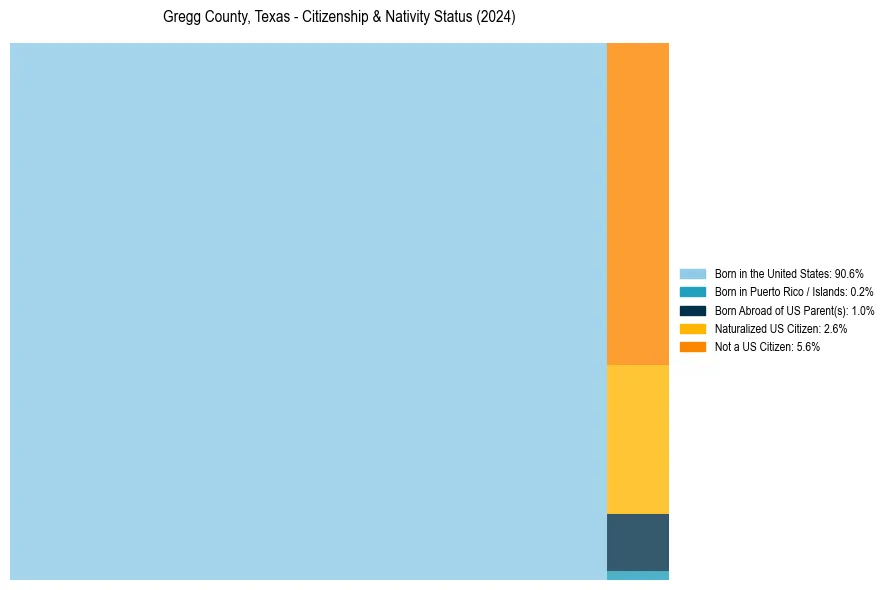
Gregg County, Texas Nativity & Citizenship Distribution
Gregg County, Texas Historical Nativity Trends (2010–2024)
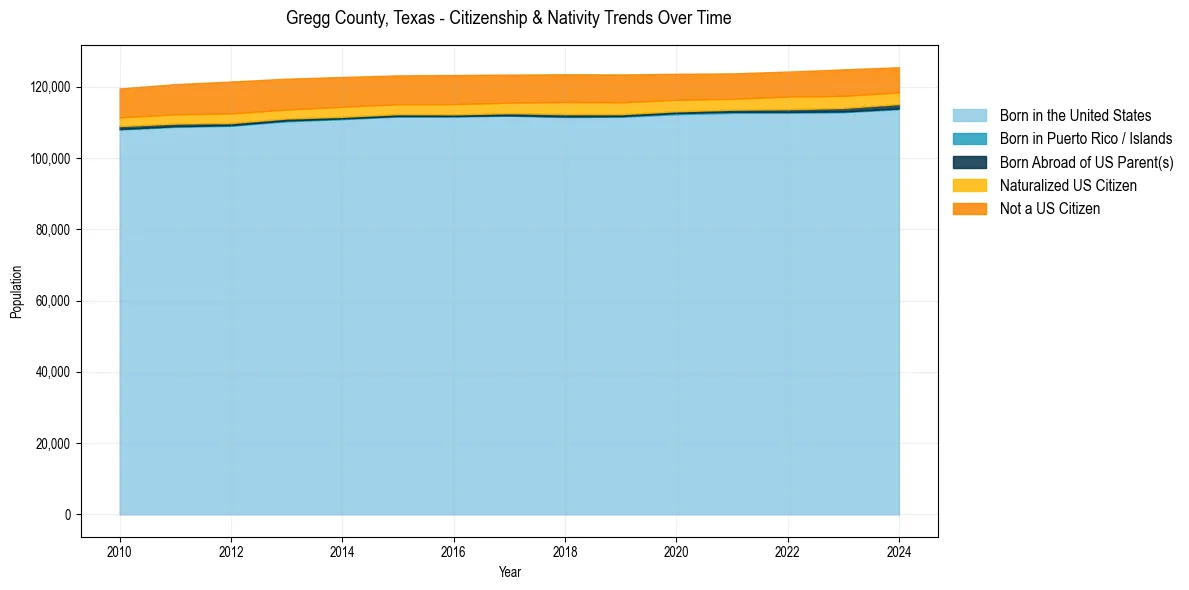
Gregg County, Texas Population & Nativity History
| Year | Total Pop | Foreign Born | Native Born |
|---|---|---|---|
| 2024 | 125,480 | 8.2% | 91.8% |
| 2023 | 124,860 | 8.7% | 91.3% |
| 2022 | 124,245 | 8.5% | 91.5% |
| 2021 | 123,744 | 8.2% | 91.8% |
| 2020 | 123,633 | 8.5% | 91.5% |
| 2019 | 123,443 | 9.0% | 91.0% |
| 2018 | 123,494 | 9.1% | 90.9% |
| 2017 | 123,402 | 8.8% | 91.2% |
| 2016 | 123,283 | 8.9% | 91.1% |
| 2015 | 123,178 | 8.8% | 91.2% |
| 2014 | 122,736 | 9.1% | 90.9% |
| 2013 | 122,258 | 9.1% | 90.9% |
| 2012 | 121,451 | 9.6% | 90.4% |
| 2011 | 120,728 | 9.2% | 90.8% |
| 2010 | 119,525 | 8.8% | 91.2% |
Nativity & Citizenship FAQs for Gregg County, Texas
Approximately 8.2% of residents in Gregg County, Texas were born outside the United States.
The vast majority of residents, roughly 94.4%, are U.S. citizens (including both native-born and naturalized citizens).