Grayson County, Texas Nativity & Citizenship Status (2024)
Place of birth and citizenship status analysis for Grayson County, Texas
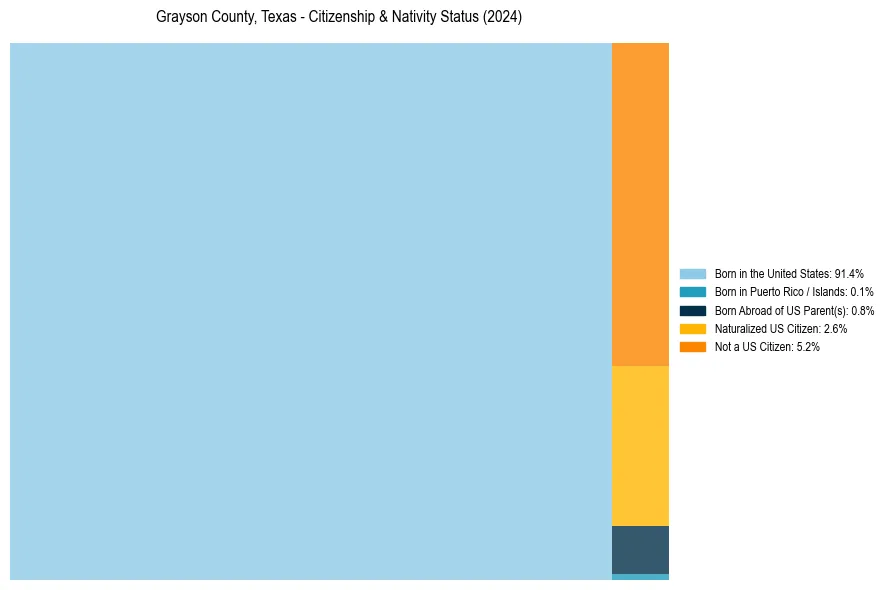
Grayson County, Texas Nativity & Citizenship Indicators (2024)
Native Born
92.3%
Foreign Born
7.7%
Naturalized
2.6%
US Citizens
94.8%
Grayson County, Texas Nativity & Citizenship Distribution
Grayson County, Texas Historical Nativity Trends (2010–2024)
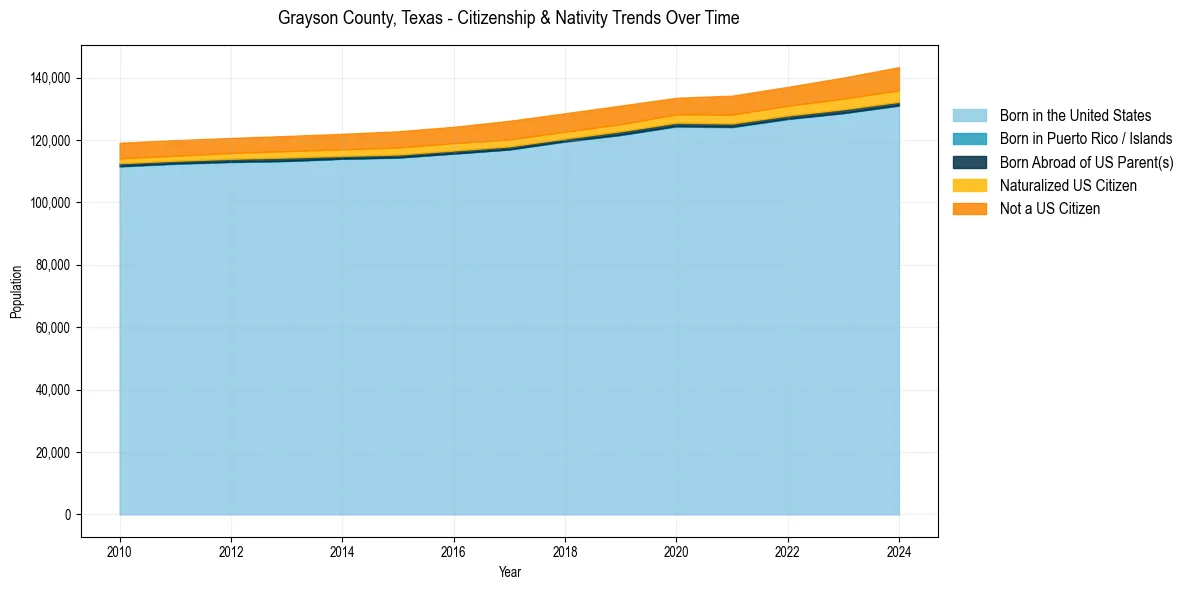
Grayson County, Texas Population & Nativity History
| Year | Total Pop | Foreign Born | Native Born |
|---|---|---|---|
| 2024 | 143,337 | 7.7% | 92.3% |
| 2023 | 139,988 | 7.2% | 92.8% |
| 2022 | 137,008 | 6.7% | 93.3% |
| 2021 | 134,205 | 6.6% | 93.4% |
| 2020 | 133,527 | 6.0% | 94.0% |
| 2019 | 131,014 | 6.3% | 93.7% |
| 2018 | 128,560 | 6.3% | 93.7% |
| 2017 | 126,146 | 6.5% | 93.5% |
| 2016 | 124,231 | 6.1% | 93.9% |
| 2015 | 122,780 | 6.1% | 93.9% |
| 2014 | 121,975 | 5.8% | 94.2% |
| 2013 | 121,292 | 5.7% | 94.3% |
| 2012 | 120,641 | 5.5% | 94.5% |
| 2011 | 119,949 | 5.5% | 94.5% |
| 2010 | 119,111 | 5.5% | 94.5% |
Nativity & Citizenship FAQs for Grayson County, Texas
Approximately 7.7% of residents in Grayson County, Texas were born outside the United States.
The vast majority of residents, roughly 94.8%, are U.S. citizens (including both native-born and naturalized citizens).