Galveston County, Texas Nativity & Citizenship Status (2024)
Place of birth and citizenship status analysis for Galveston County, Texas
Galveston County, Texas Nativity & Citizenship Indicators (2024)
Native Born
89.8%
Foreign Born
10.2%
Naturalized
5.1%
US Citizens
95.0%
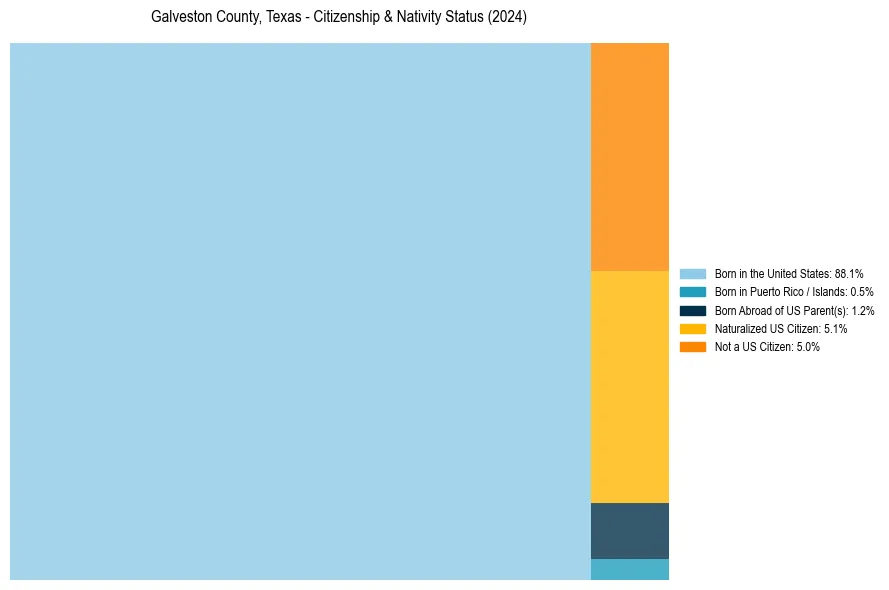
Galveston County, Texas Nativity & Citizenship Distribution
Galveston County, Texas Historical Nativity Trends (2010–2024)
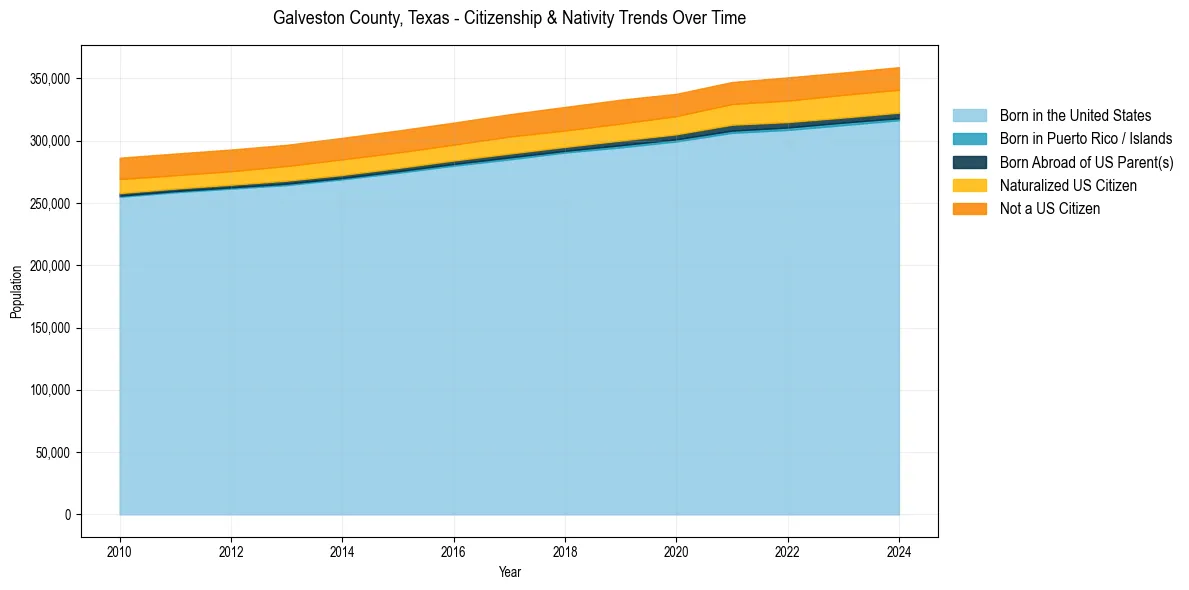
Galveston County, Texas Population & Nativity History
| Year | Total Pop | Foreign Born | Native Born |
|---|---|---|---|
| 2024 | 358,990 | 10.2% | 89.8% |
| 2023 | 354,721 | 10.2% | 89.8% |
| 2022 | 350,801 | 10.2% | 89.8% |
| 2021 | 347,084 | 9.9% | 90.1% |
| 2020 | 337,600 | 9.6% | 90.4% |
| 2019 | 332,885 | 9.9% | 90.1% |
| 2018 | 327,089 | 9.8% | 90.2% |
| 2017 | 321,184 | 9.8% | 90.2% |
| 2016 | 314,485 | 9.7% | 90.3% |
| 2015 | 308,163 | 9.8% | 90.2% |
| 2014 | 302,276 | 9.9% | 90.1% |
| 2013 | 296,669 | 9.7% | 90.3% |
| 2012 | 292,874 | 9.7% | 90.3% |
| 2011 | 289,658 | 9.7% | 90.3% |
| 2010 | 286,326 | 9.9% | 90.1% |
Nativity & Citizenship FAQs for Galveston County, Texas
Approximately 10.2% of residents in Galveston County, Texas were born outside the United States.
The vast majority of residents, roughly 95.0%, are U.S. citizens (including both native-born and naturalized citizens).