Fort Bend County, Texas Nativity & Citizenship Status (2024)
Place of birth and citizenship status analysis for Fort Bend County, Texas
Fort Bend County, Texas Nativity & Citizenship Indicators (2024)
Native Born
69.5%
Foreign Born
30.5%
Naturalized
17.7%
US Citizens
87.2%
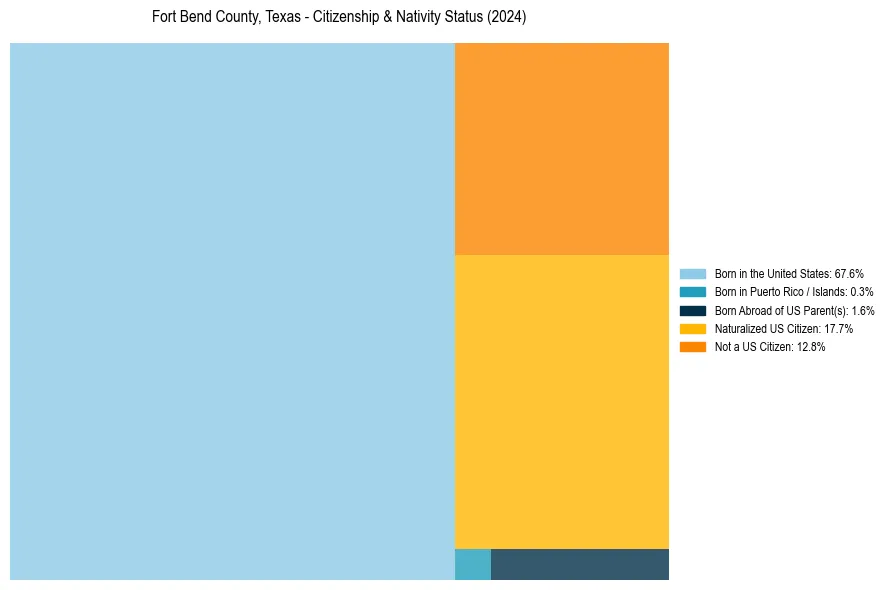
Fort Bend County, Texas Nativity & Citizenship Distribution
Fort Bend County, Texas Historical Nativity Trends (2010–2024)
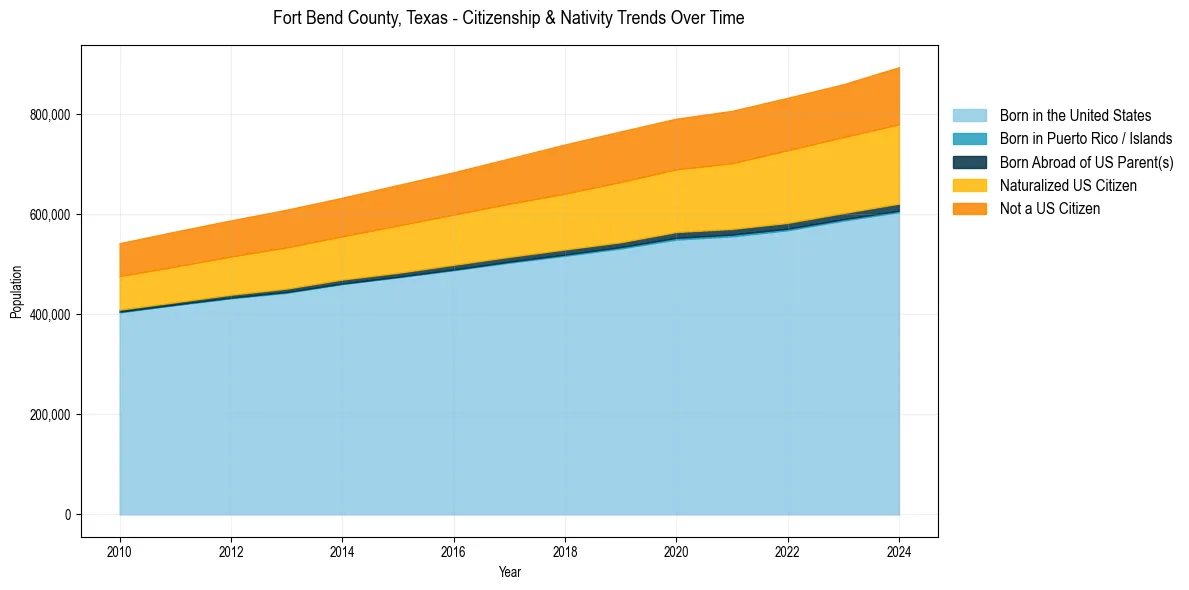
Fort Bend County, Texas Population & Nativity History
| Year | Total Pop | Foreign Born | Native Born |
|---|---|---|---|
| 2024 | 893,767 | 30.5% | 69.5% |
| 2023 | 859,721 | 30.0% | 70.0% |
| 2022 | 832,607 | 30.0% | 70.0% |
| 2021 | 806,497 | 29.3% | 70.7% |
| 2020 | 790,892 | 28.6% | 71.4% |
| 2019 | 765,394 | 28.9% | 71.1% |
| 2018 | 739,342 | 28.4% | 71.6% |
| 2017 | 711,421 | 27.6% | 72.4% |
| 2016 | 683,756 | 27.1% | 72.9% |
| 2015 | 658,331 | 26.7% | 73.3% |
| 2014 | 632,946 | 25.9% | 74.1% |
| 2013 | 608,939 | 25.9% | 74.1% |
| 2012 | 587,666 | 25.3% | 74.7% |
| 2011 | 565,295 | 25.0% | 75.0% |
| 2010 | 541,983 | 24.5% | 75.5% |
Nativity & Citizenship FAQs for Fort Bend County, Texas
Approximately 30.5% of residents in Fort Bend County, Texas were born outside the United States.
The vast majority of residents, roughly 87.2%, are U.S. citizens (including both native-born and naturalized citizens).