Ellis County, Texas Nativity & Citizenship Status (2024)
Place of birth and citizenship status analysis for Ellis County, Texas
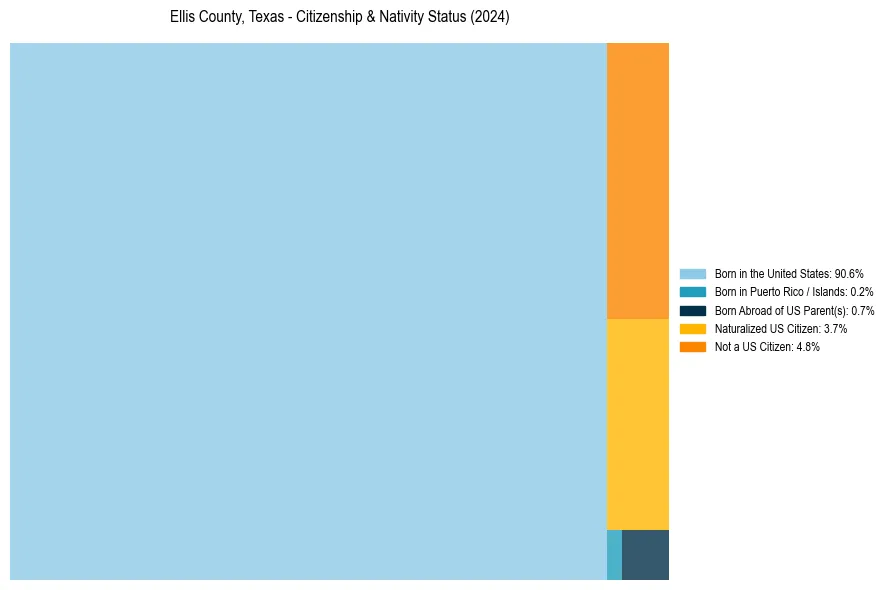
Ellis County, Texas Nativity & Citizenship Indicators (2024)
Native Born
91.5%
Foreign Born
8.5%
Naturalized
3.7%
US Citizens
95.2%
Ellis County, Texas Nativity & Citizenship Distribution
Ellis County, Texas Historical Nativity Trends (2010–2024)
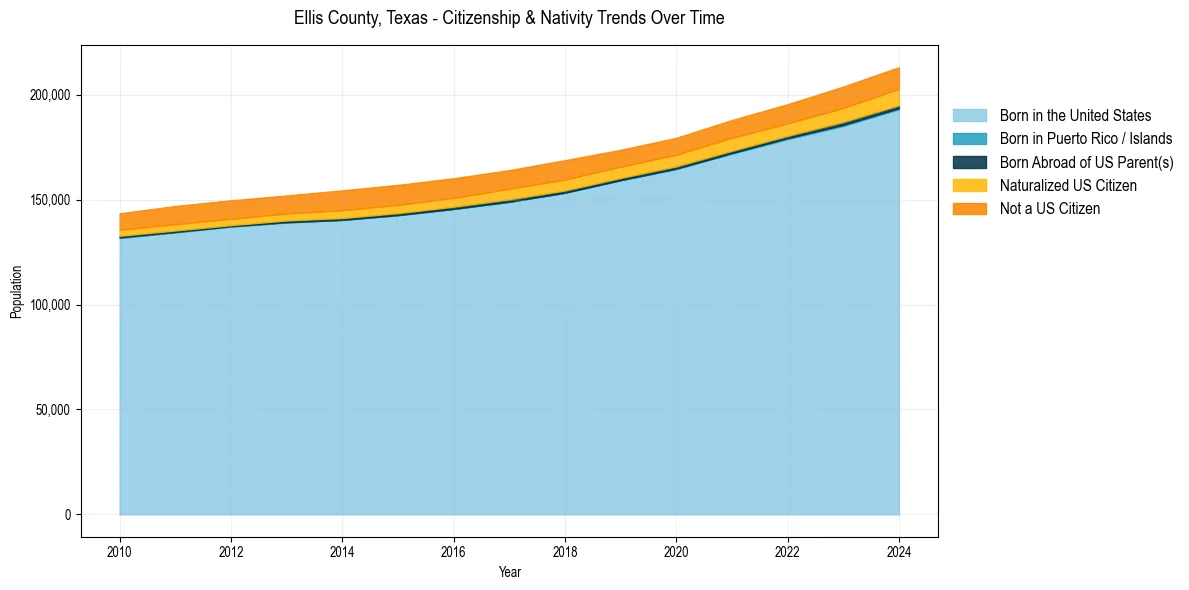
Ellis County, Texas Population & Nativity History
| Year | Total Pop | Foreign Born | Native Born |
|---|---|---|---|
| 2024 | 213,160 | 8.5% | 91.5% |
| 2023 | 203,927 | 8.3% | 91.7% |
| 2022 | 195,509 | 7.7% | 92.3% |
| 2021 | 187,984 | 7.8% | 92.2% |
| 2020 | 179,484 | 7.6% | 92.4% |
| 2019 | 173,772 | 7.7% | 92.3% |
| 2018 | 168,838 | 8.6% | 91.4% |
| 2017 | 164,092 | 8.5% | 91.5% |
| 2016 | 160,225 | 8.5% | 91.5% |
| 2015 | 157,058 | 8.6% | 91.4% |
| 2014 | 154,447 | 8.5% | 91.5% |
| 2013 | 152,020 | 7.8% | 92.2% |
| 2012 | 149,712 | 7.9% | 92.1% |
| 2011 | 146,997 | 8.0% | 92.0% |
| 2010 | 143,502 | 7.5% | 92.5% |
Nativity & Citizenship FAQs for Ellis County, Texas
Approximately 8.5% of residents in Ellis County, Texas were born outside the United States.
The vast majority of residents, roughly 95.2%, are U.S. citizens (including both native-born and naturalized citizens).