El Paso County, Texas Nativity & Citizenship Status (2024)
Place of birth and citizenship status analysis for El Paso County, Texas
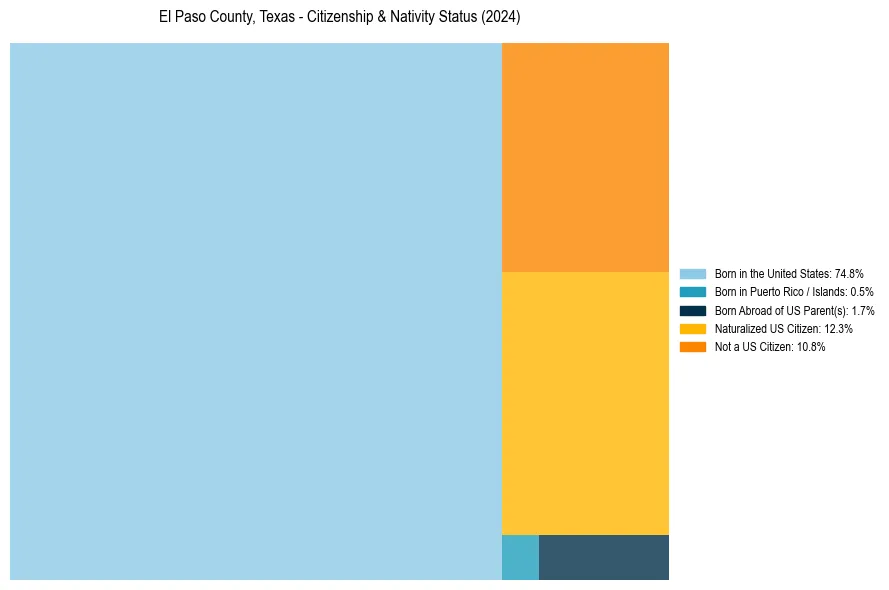
El Paso County, Texas Nativity & Citizenship Indicators (2024)
Native Born
76.9%
Foreign Born
23.1%
Naturalized
12.3%
US Citizens
89.2%
El Paso County, Texas Nativity & Citizenship Distribution
El Paso County, Texas Historical Nativity Trends (2010–2024)
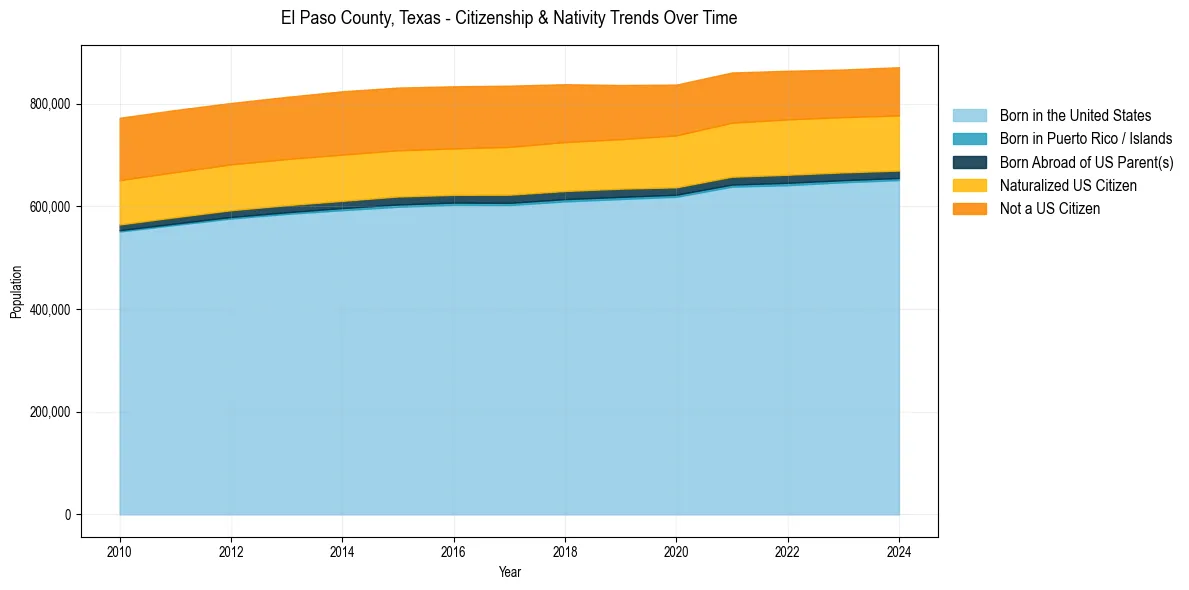
El Paso County, Texas Population & Nativity History
| Year | Total Pop | Foreign Born | Native Born |
|---|---|---|---|
| 2024 | 870,779 | 23.1% | 76.9% |
| 2023 | 866,275 | 23.1% | 76.9% |
| 2022 | 863,832 | 23.4% | 76.6% |
| 2021 | 860,485 | 23.6% | 76.4% |
| 2020 | 836,915 | 23.9% | 76.1% |
| 2019 | 836,062 | 24.1% | 75.9% |
| 2018 | 837,654 | 24.8% | 75.2% |
| 2017 | 834,825 | 25.4% | 74.6% |
| 2016 | 833,592 | 25.4% | 74.6% |
| 2015 | 831,095 | 25.5% | 74.5% |
| 2014 | 823,862 | 25.9% | 74.1% |
| 2013 | 813,015 | 26.0% | 74.0% |
| 2012 | 801,115 | 26.1% | 73.9% |
| 2011 | 787,410 | 26.5% | 73.5% |
| 2010 | 772,280 | 26.9% | 73.1% |
Nativity & Citizenship FAQs for El Paso County, Texas
Approximately 23.1% of residents in El Paso County, Texas were born outside the United States.
The vast majority of residents, roughly 89.2%, are U.S. citizens (including both native-born and naturalized citizens).