El Paso County, Texas Health Insurance Coverage (2024)
Detailed analysis of uninsured rates and coverage trends for El Paso County, Texas
Universe
844,384
Total Uninsured
182,797
Uninsured Rate
21.6%
Coverage by Age and Gender
Distribution of insured vs. uninsured residents in El Paso County, Texas
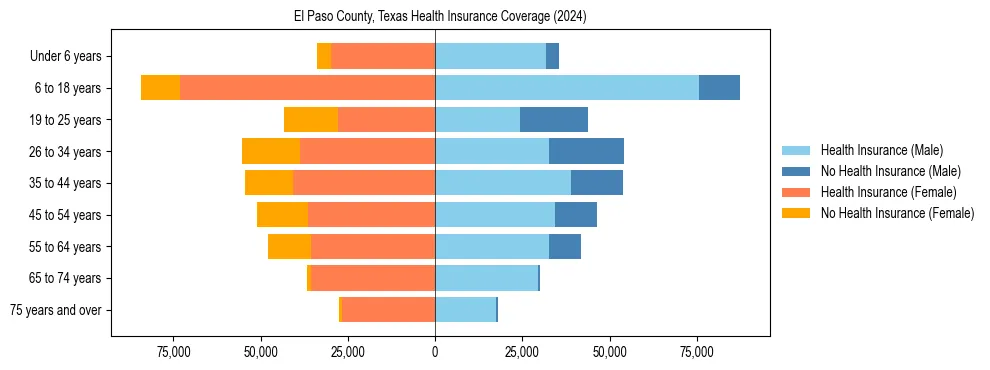
Uninsured Rates by Demographic Group
Under 18 Years
Male Uninsured12.4%
Female Uninsured12.7%
18 to 34 Years
Male Uninsured41.8%
Female Uninsured32.7%
35 to 64 Years
Male Uninsured25.3%
Female Uninsured26.6%
65 Years & Over
Male Uninsured2.7%
Female Uninsured2.5%
Uninsured Rate Trends
Historical coverage data from 2012 to 2024
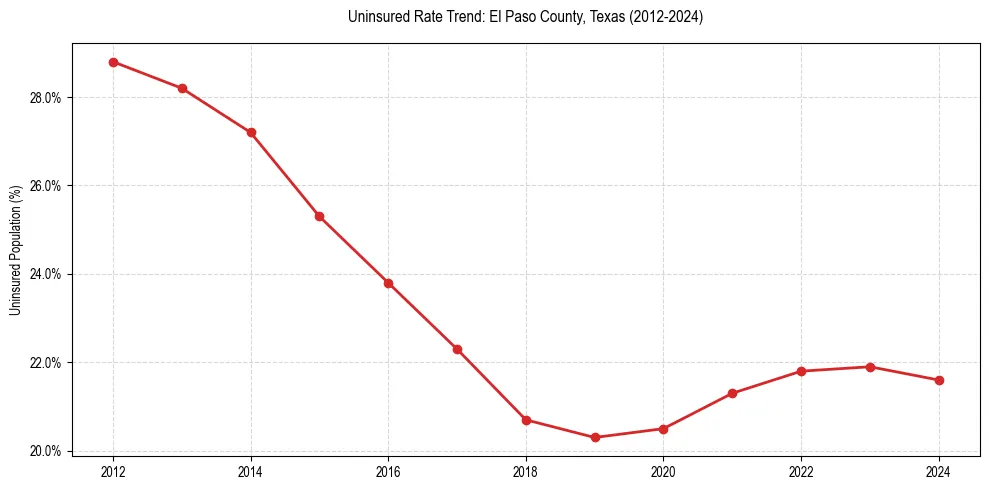
| Year | Total Uninsured | Uninsured Rate |
|---|---|---|
| 2024 | 182,797 | 21.6% |
| 2023 | 183,701 | 21.9% |
| 2022 | 183,261 | 21.8% |
| 2021 | 177,706 | 21.3% |
| 2020 | 166,909 | 20.5% |
| 2019 | 164,847 | 20.3% |
| 2018 | 168,273 | 20.7% |
| 2017 | 180,360 | 22.3% |
| 2016 | 191,918 | 23.8% |
| 2015 | 203,810 | 25.3% |
| 2014 | 217,062 | 27.2% |
| 2013 | 222,875 | 28.2% |
| 2012 | 224,300 | 28.8% |
Frequently Asked Questions
Approximately 21.6% of the population in El Paso County, Texas does not have health insurance coverage.
In El Paso County, Texas, young adult males (18-34) face the highest barrier to coverage, with an uninsured rate of 41.8%. This is notably higher than the overall local average of 21.6%.