Denton County, Texas Nativity & Citizenship Status (2024)
Place of birth and citizenship status analysis for Denton County, Texas
Denton County, Texas Nativity & Citizenship Indicators (2024)
Native Born
82.6%
Foreign Born
17.4%
Naturalized
8.9%
US Citizens
91.5%
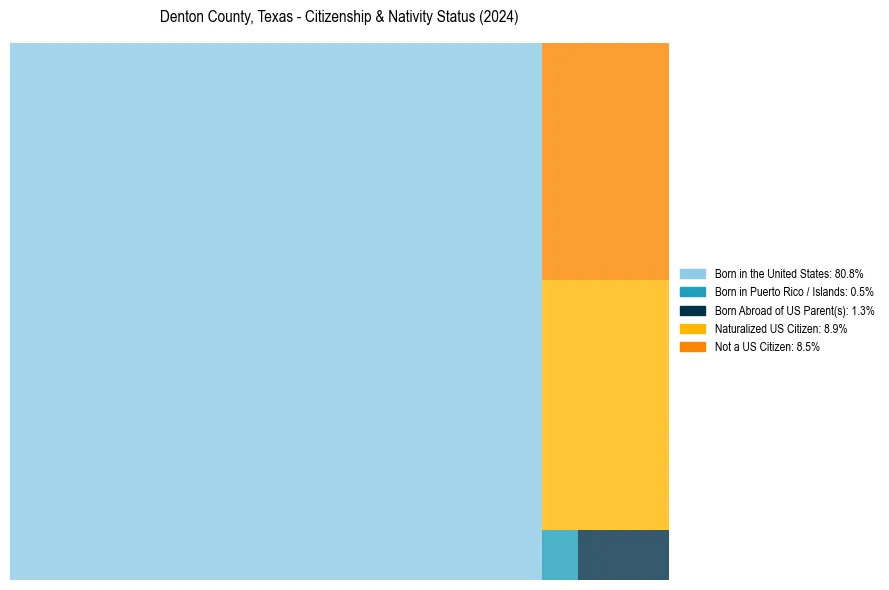
Denton County, Texas Nativity & Citizenship Distribution
Denton County, Texas Historical Nativity Trends (2010–2024)
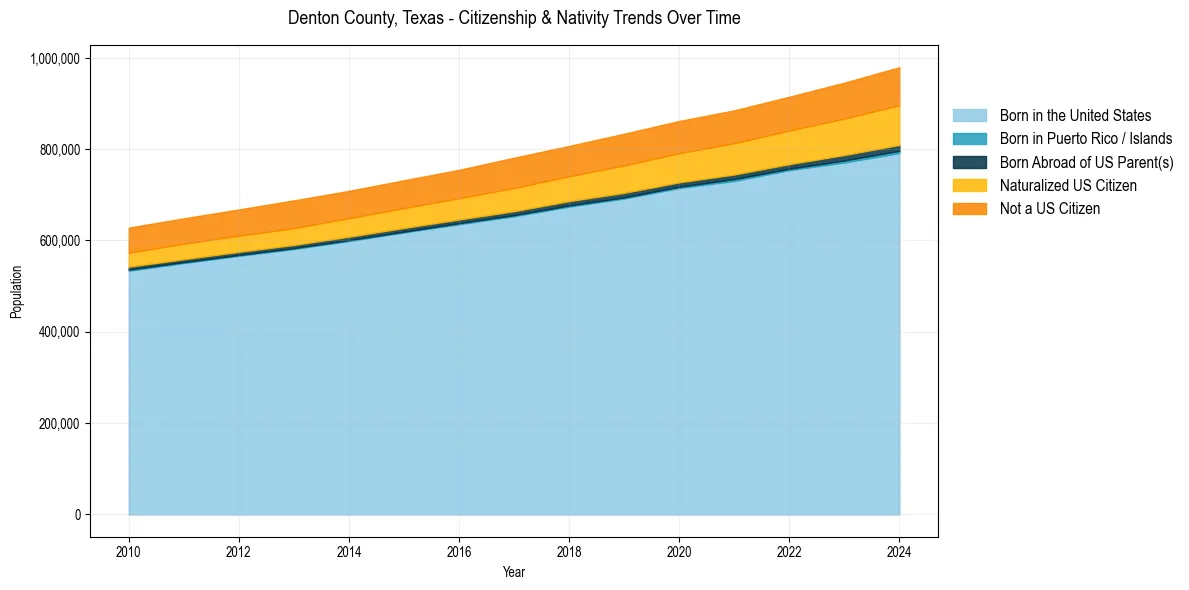
Denton County, Texas Population & Nativity History
| Year | Total Pop | Foreign Born | Native Born |
|---|---|---|---|
| 2024 | 979,561 | 17.4% | 82.6% |
| 2023 | 945,644 | 16.8% | 83.2% |
| 2022 | 914,870 | 16.1% | 83.9% |
| 2021 | 885,012 | 15.9% | 84.1% |
| 2020 | 861,690 | 15.6% | 84.4% |
| 2019 | 833,822 | 15.5% | 84.5% |
| 2018 | 807,047 | 15.0% | 85.0% |
| 2017 | 781,321 | 15.0% | 85.0% |
| 2016 | 754,650 | 14.4% | 85.6% |
| 2015 | 731,851 | 14.3% | 85.7% |
| 2014 | 708,627 | 14.2% | 85.8% |
| 2013 | 687,857 | 14.2% | 85.8% |
| 2012 | 667,934 | 13.9% | 86.1% |
| 2011 | 648,470 | 13.8% | 86.2% |
| 2010 | 628,084 | 13.6% | 86.4% |
Nativity & Citizenship FAQs for Denton County, Texas
Approximately 17.4% of residents in Denton County, Texas were born outside the United States.
The vast majority of residents, roughly 91.5%, are U.S. citizens (including both native-born and naturalized citizens).