Dallas County, Texas Nativity & Citizenship Status (2024)
Place of birth and citizenship status analysis for Dallas County, Texas
Dallas County, Texas Nativity & Citizenship Indicators (2024)
Native Born
75.2%
Foreign Born
24.8%
Naturalized
8.6%
US Citizens
83.8%
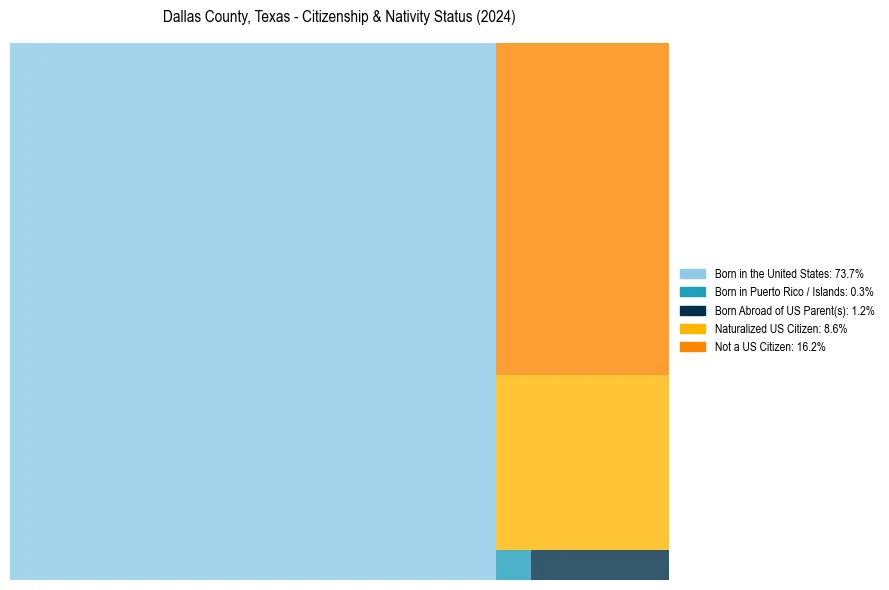
Dallas County, Texas Nativity & Citizenship Distribution
Dallas County, Texas Historical Nativity Trends (2010–2024)
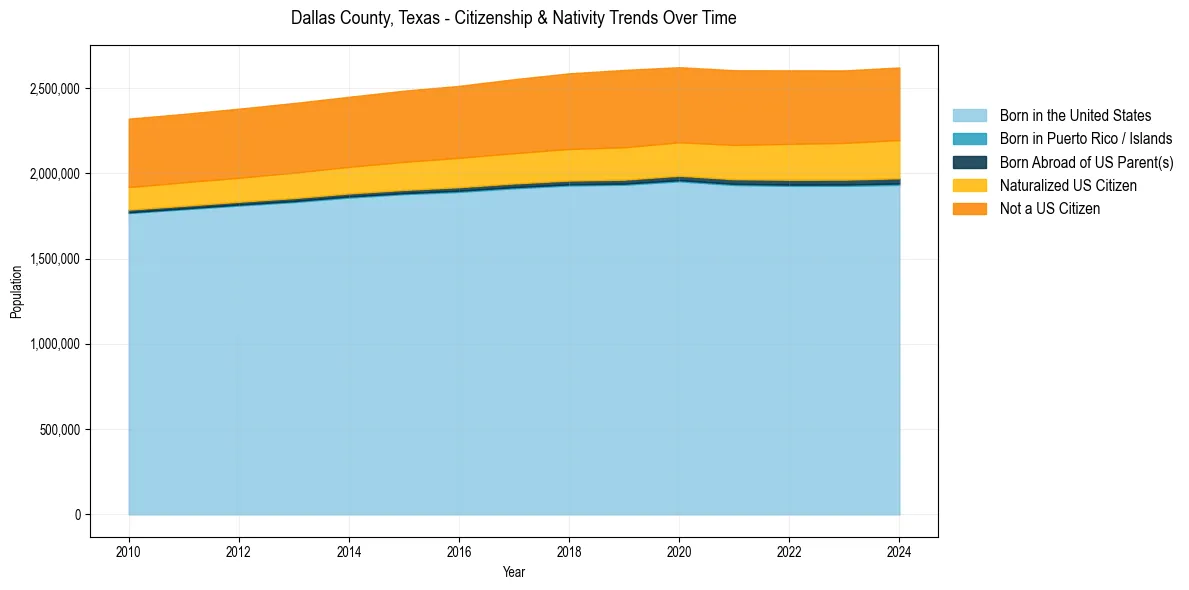
Dallas County, Texas Population & Nativity History
| Year | Total Pop | Foreign Born | Native Born |
|---|---|---|---|
| 2024 | 2,621,179 | 24.8% | 75.2% |
| 2023 | 2,603,816 | 24.6% | 75.4% |
| 2022 | 2,604,053 | 24.6% | 75.4% |
| 2021 | 2,604,722 | 24.5% | 75.5% |
| 2020 | 2,622,634 | 24.3% | 75.7% |
| 2019 | 2,606,868 | 24.7% | 75.3% |
| 2018 | 2,586,552 | 24.3% | 75.7% |
| 2017 | 2,552,213 | 24.0% | 76.0% |
| 2016 | 2,513,054 | 23.6% | 76.4% |
| 2015 | 2,485,003 | 23.4% | 76.6% |
| 2014 | 2,448,943 | 23.1% | 76.9% |
| 2013 | 2,412,481 | 23.1% | 76.9% |
| 2012 | 2,379,214 | 22.9% | 77.1% |
| 2011 | 2,348,702 | 23.0% | 77.0% |
| 2010 | 2,321,014 | 23.0% | 77.0% |
Nativity & Citizenship FAQs for Dallas County, Texas
Approximately 24.8% of residents in Dallas County, Texas were born outside the United States.
The vast majority of residents, roughly 83.8%, are U.S. citizens (including both native-born and naturalized citizens).