Coryell County, Texas Nativity & Citizenship Status (2024)
Place of birth and citizenship status analysis for Coryell County, Texas
Coryell County, Texas Nativity & Citizenship Indicators (2024)
Native Born
93.9%
Foreign Born
6.1%
Naturalized
3.0%
US Citizens
96.9%
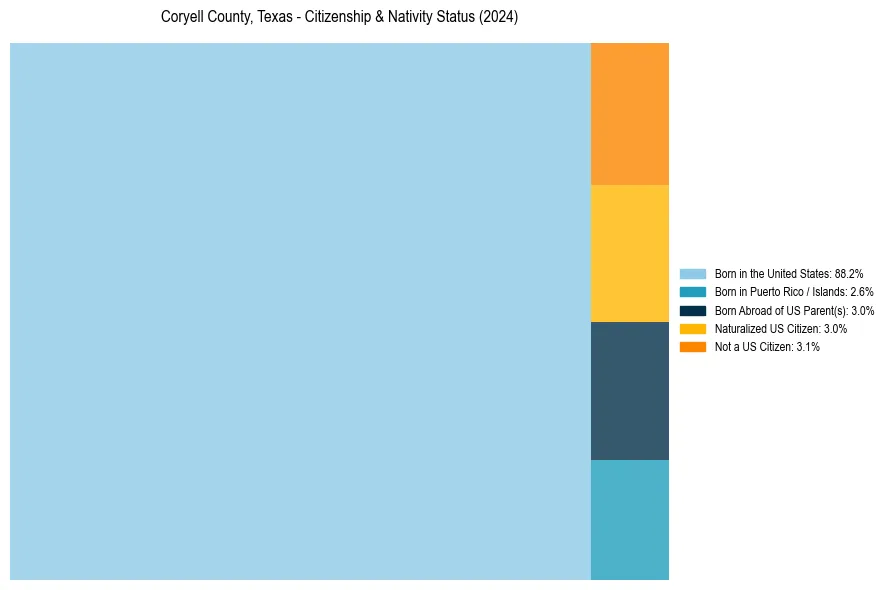
Coryell County, Texas Nativity & Citizenship Distribution
Coryell County, Texas Historical Nativity Trends (2010–2024)
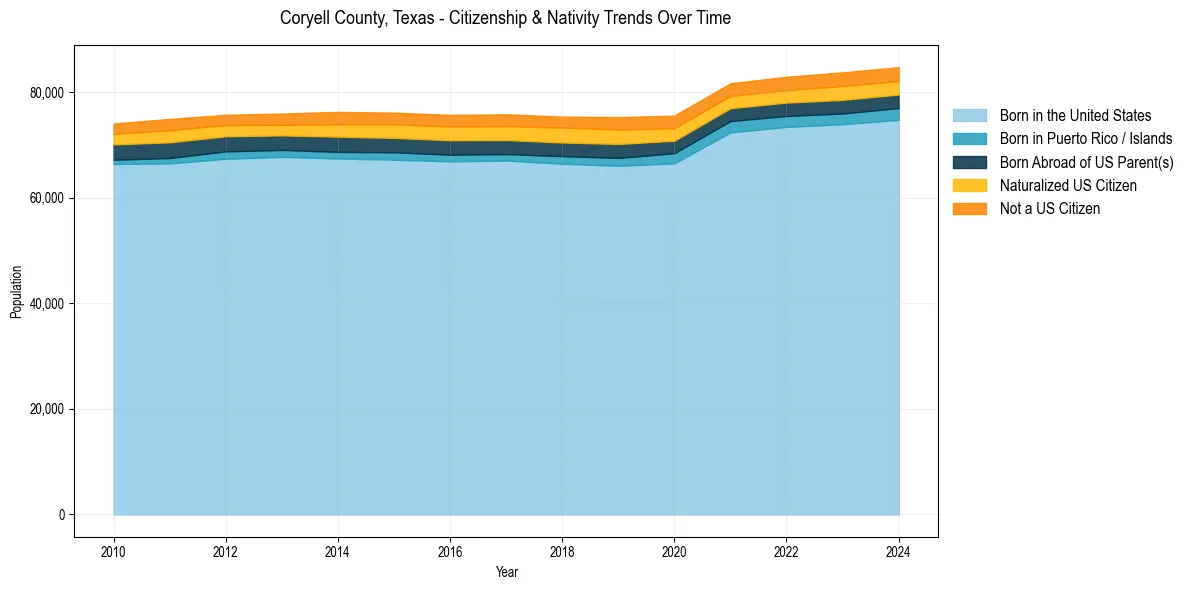
Coryell County, Texas Population & Nativity History
| Year | Total Pop | Foreign Born | Native Born |
|---|---|---|---|
| 2024 | 84,748 | 6.1% | 93.9% |
| 2023 | 83,772 | 6.2% | 93.8% |
| 2022 | 82,927 | 5.9% | 94.1% |
| 2021 | 81,692 | 5.8% | 94.2% |
| 2020 | 75,576 | 6.3% | 93.7% |
| 2019 | 75,280 | 6.8% | 93.2% |
| 2018 | 75,389 | 6.5% | 93.5% |
| 2017 | 75,818 | 6.4% | 93.6% |
| 2016 | 75,710 | 6.3% | 93.7% |
| 2015 | 76,128 | 6.3% | 93.7% |
| 2014 | 76,276 | 6.2% | 93.8% |
| 2013 | 75,966 | 5.5% | 94.5% |
| 2012 | 75,728 | 5.4% | 94.6% |
| 2011 | 74,948 | 5.9% | 94.1% |
| 2010 | 74,082 | 5.4% | 94.6% |
Nativity & Citizenship FAQs for Coryell County, Texas
Approximately 6.1% of residents in Coryell County, Texas were born outside the United States.
The vast majority of residents, roughly 96.9%, are U.S. citizens (including both native-born and naturalized citizens).