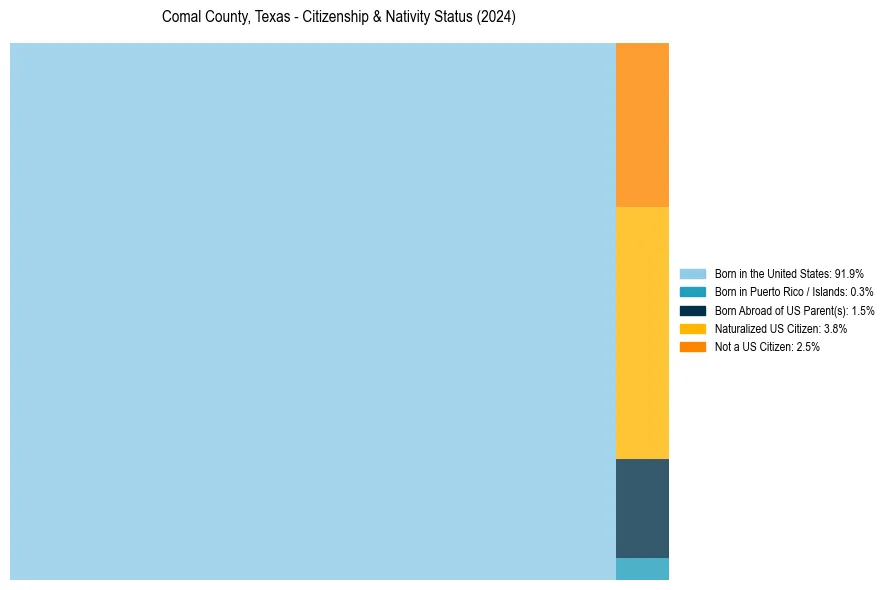
Comal County, Texas Nativity & Citizenship Status (2024)
Place of birth and citizenship status analysis for Comal County, Texas
Comal County, Texas Nativity & Citizenship Indicators (2024)
Native Born
93.8%
Foreign Born
6.2%
Naturalized
3.8%
US Citizens
97.5%
Comal County, Texas Nativity & Citizenship Distribution
Comal County, Texas Historical Nativity Trends (2010–2024)
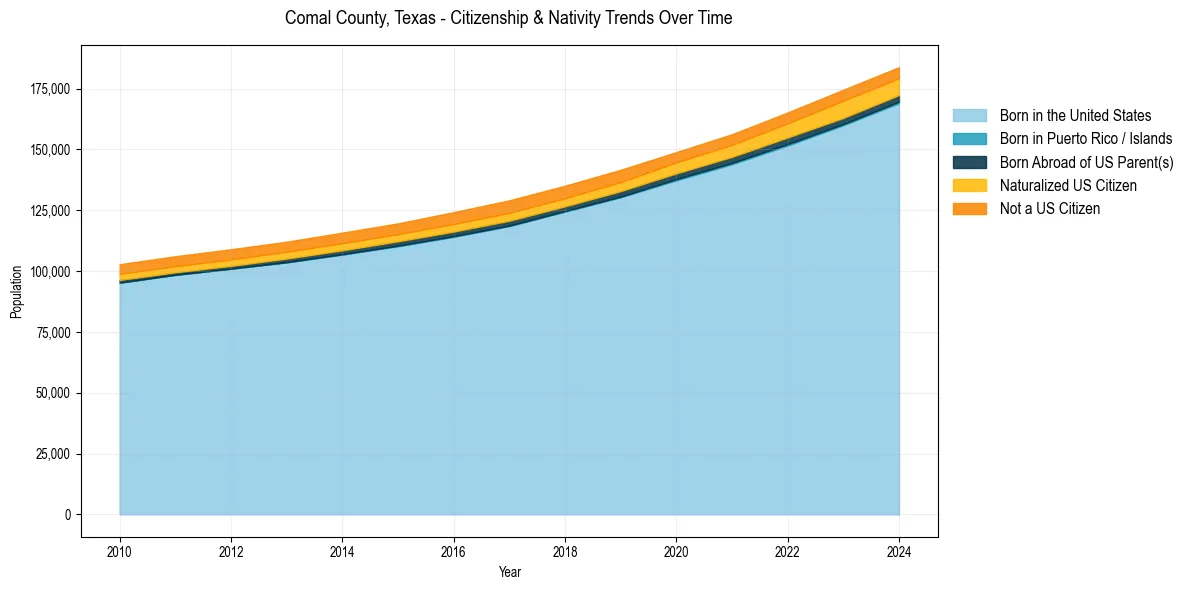
Comal County, Texas Population & Nativity History
| Year | Total Pop | Foreign Born | Native Born |
|---|---|---|---|
| 2024 | 183,826 | 6.2% | 93.8% |
| 2023 | 174,552 | 6.6% | 93.4% |
| 2022 | 165,201 | 6.2% | 93.8% |
| 2021 | 156,257 | 6.0% | 94.0% |
| 2020 | 148,921 | 5.9% | 94.1% |
| 2019 | 141,642 | 6.2% | 93.8% |
| 2018 | 135,097 | 6.3% | 93.7% |
| 2017 | 129,100 | 6.5% | 93.5% |
| 2016 | 124,234 | 6.4% | 93.6% |
| 2015 | 119,632 | 6.2% | 93.8% |
| 2014 | 115,808 | 6.3% | 93.7% |
| 2013 | 112,083 | 6.2% | 93.8% |
| 2012 | 108,985 | 6.3% | 93.7% |
| 2011 | 106,111 | 6.2% | 93.8% |
| 2010 | 102,836 | 6.3% | 93.7% |
Nativity & Citizenship FAQs for Comal County, Texas
Approximately 6.2% of residents in Comal County, Texas were born outside the United States.
The vast majority of residents, roughly 97.5%, are U.S. citizens (including both native-born and naturalized citizens).