Collin County, Texas Nativity & Citizenship Status (2024)
Place of birth and citizenship status analysis for Collin County, Texas
Collin County, Texas Nativity & Citizenship Indicators (2024)
Native Born
76.7%
Foreign Born
23.3%
Naturalized
11.8%
US Citizens
88.5%
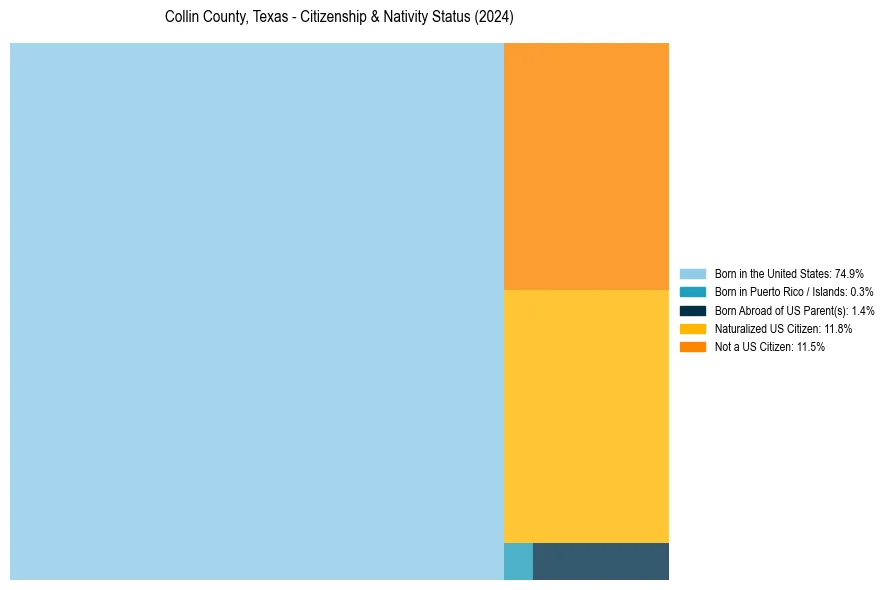
Collin County, Texas Nativity & Citizenship Distribution
Collin County, Texas Historical Nativity Trends (2010–2024)
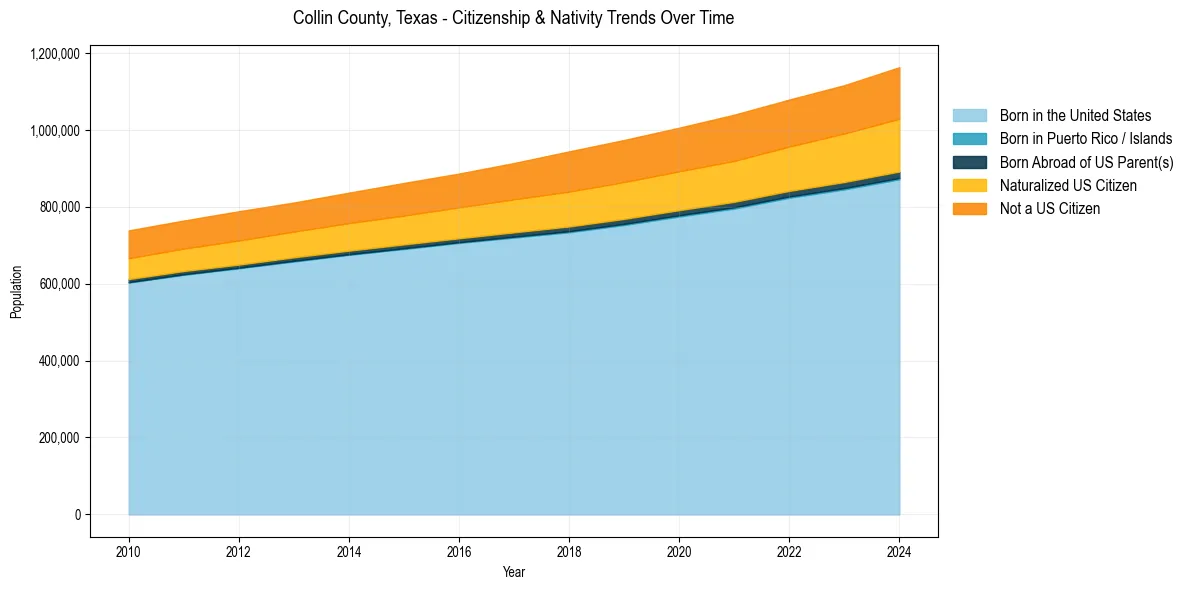
Collin County, Texas Population & Nativity History
| Year | Total Pop | Foreign Born | Native Born |
|---|---|---|---|
| 2024 | 1,163,337 | 23.3% | 76.7% |
| 2023 | 1,116,601 | 22.6% | 77.4% |
| 2022 | 1,079,153 | 22.0% | 78.0% |
| 2021 | 1,039,812 | 21.8% | 78.2% |
| 2020 | 1,006,038 | 21.3% | 78.7% |
| 2019 | 973,977 | 21.1% | 78.9% |
| 2018 | 944,350 | 20.7% | 79.3% |
| 2017 | 914,075 | 19.7% | 80.3% |
| 2016 | 886,633 | 19.0% | 81.0% |
| 2015 | 862,215 | 18.5% | 81.5% |
| 2014 | 836,947 | 18.0% | 82.0% |
| 2013 | 811,308 | 17.6% | 82.4% |
| 2012 | 788,580 | 17.6% | 82.4% |
| 2011 | 764,424 | 17.2% | 82.8% |
| 2010 | 738,745 | 17.2% | 82.8% |
Nativity & Citizenship FAQs for Collin County, Texas
Approximately 23.3% of residents in Collin County, Texas were born outside the United States.
The vast majority of residents, roughly 88.5%, are U.S. citizens (including both native-born and naturalized citizens).