Cameron County, Texas Nativity & Citizenship Status (2024)
Place of birth and citizenship status analysis for Cameron County, Texas
Cameron County, Texas Nativity & Citizenship Indicators (2024)
Native Born
76.8%
Foreign Born
23.2%
Naturalized
9.0%
US Citizens
85.8%
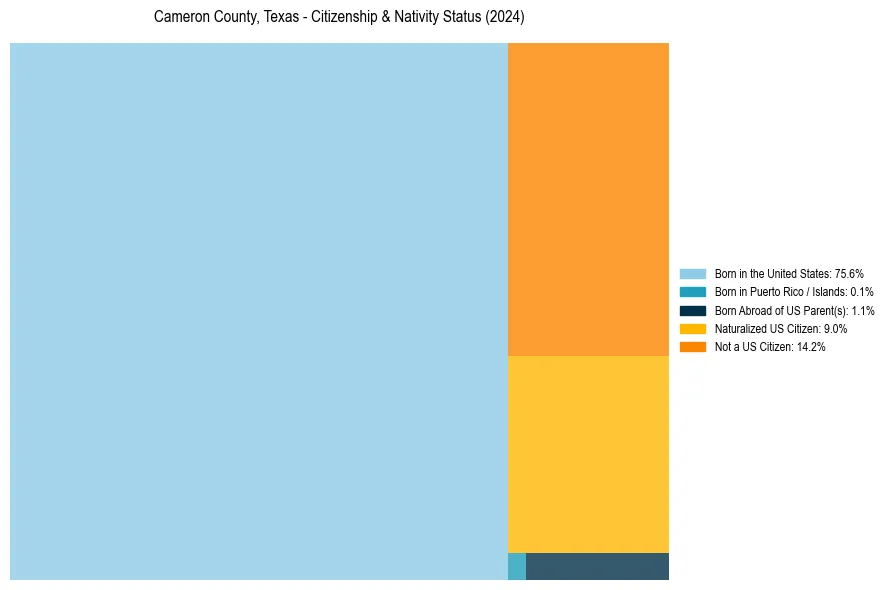
Cameron County, Texas Nativity & Citizenship Distribution
Cameron County, Texas Historical Nativity Trends (2010–2024)
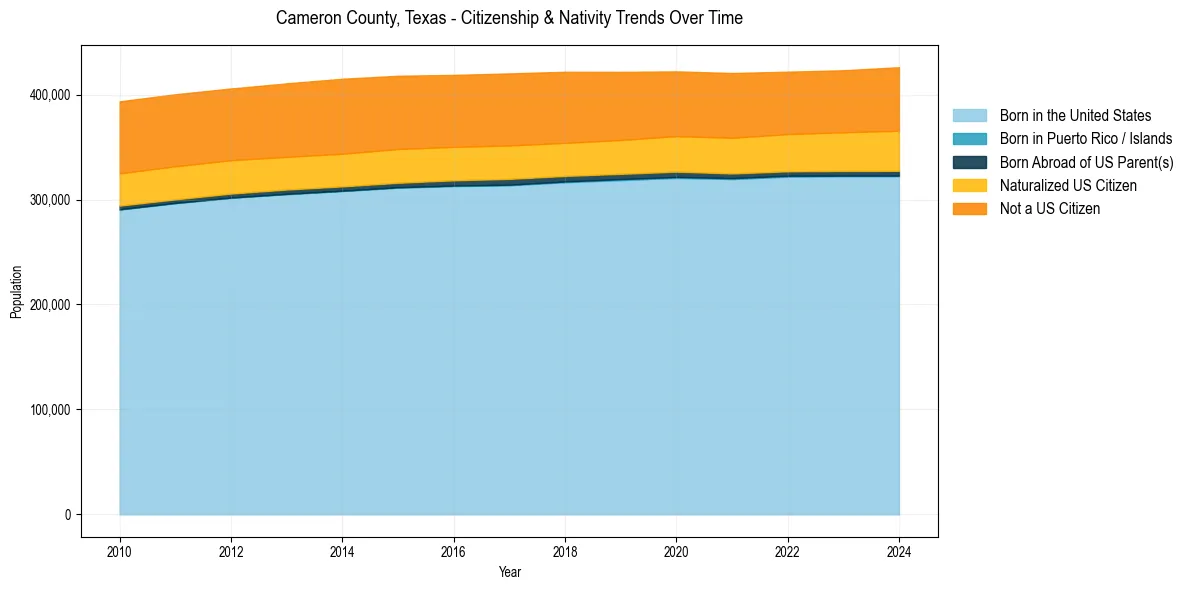
Cameron County, Texas Population & Nativity History
| Year | Total Pop | Foreign Born | Native Born |
|---|---|---|---|
| 2024 | 426,120 | 23.2% | 76.8% |
| 2023 | 423,192 | 22.7% | 77.3% |
| 2022 | 421,854 | 22.5% | 77.5% |
| 2021 | 420,554 | 22.8% | 77.2% |
| 2020 | 422,135 | 22.6% | 77.4% |
| 2019 | 421,666 | 23.0% | 77.0% |
| 2018 | 421,750 | 23.5% | 76.5% |
| 2017 | 420,201 | 23.9% | 76.1% |
| 2016 | 418,785 | 24.0% | 76.0% |
| 2015 | 417,947 | 24.4% | 75.6% |
| 2014 | 415,103 | 24.7% | 75.3% |
| 2013 | 410,710 | 24.6% | 75.4% |
| 2012 | 405,819 | 24.7% | 75.3% |
| 2011 | 400,332 | 25.0% | 75.0% |
| 2010 | 393,566 | 25.2% | 74.8% |
Nativity & Citizenship FAQs for Cameron County, Texas
Approximately 23.2% of residents in Cameron County, Texas were born outside the United States.
The vast majority of residents, roughly 85.8%, are U.S. citizens (including both native-born and naturalized citizens).