Cameron County, Texas Health Insurance Coverage (2024)
Detailed analysis of uninsured rates and coverage trends for Cameron County, Texas
Universe
423,712
Total Uninsured
109,395
Uninsured Rate
25.8%
Coverage by Age and Gender
Distribution of insured vs. uninsured residents in Cameron County, Texas
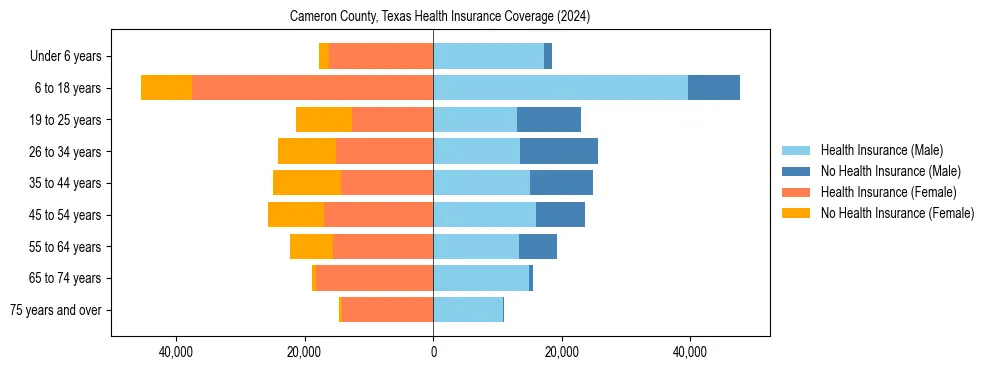
Uninsured Rates by Demographic Group
Under 18 Years
Male Uninsured14.0%
Female Uninsured15.0%
18 to 34 Years
Male Uninsured45.4%
Female Uninsured38.8%
35 to 64 Years
Male Uninsured34.1%
Female Uninsured35.7%
65 Years & Over
Male Uninsured3.2%
Female Uninsured3.0%
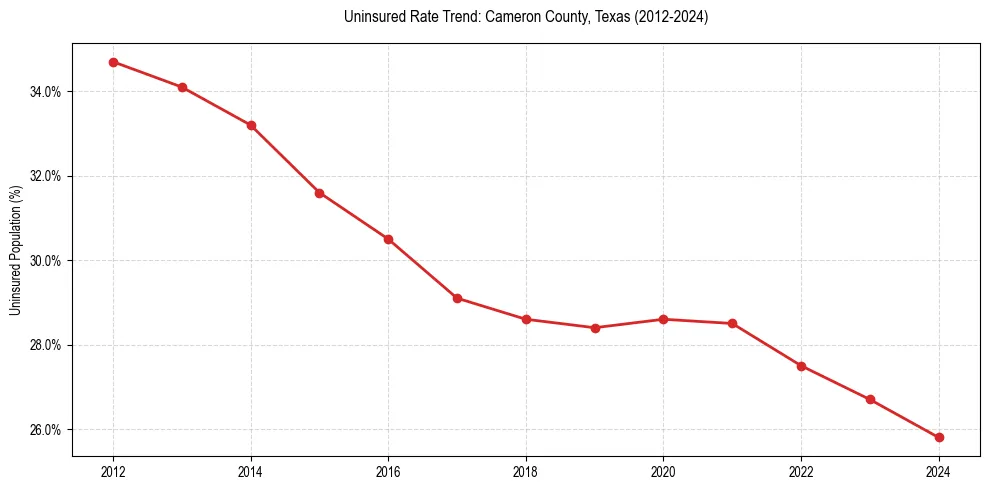
Uninsured Rate Trends
Historical coverage data from 2012 to 2024
| Year | Total Uninsured | Uninsured Rate |
|---|---|---|
| 2024 | 109,395 | 25.8% |
| 2023 | 112,632 | 26.7% |
| 2022 | 115,509 | 27.5% |
| 2021 | 119,447 | 28.5% |
| 2020 | 120,426 | 28.6% |
| 2019 | 119,164 | 28.4% |
| 2018 | 119,897 | 28.6% |
| 2017 | 121,531 | 29.1% |
| 2016 | 126,963 | 30.5% |
| 2015 | 131,201 | 31.6% |
| 2014 | 137,017 | 33.2% |
| 2013 | 139,224 | 34.1% |
| 2012 | 139,683 | 34.7% |
Frequently Asked Questions
Approximately 25.8% of the population in Cameron County, Texas does not have health insurance coverage.
In Cameron County, Texas, young adult males (18-34) face the highest barrier to coverage, with an uninsured rate of 45.4%. This is notably higher than the overall local average of 25.8%.