Brazos County, Texas Nativity & Citizenship Status (2024)
Place of birth and citizenship status analysis for Brazos County, Texas
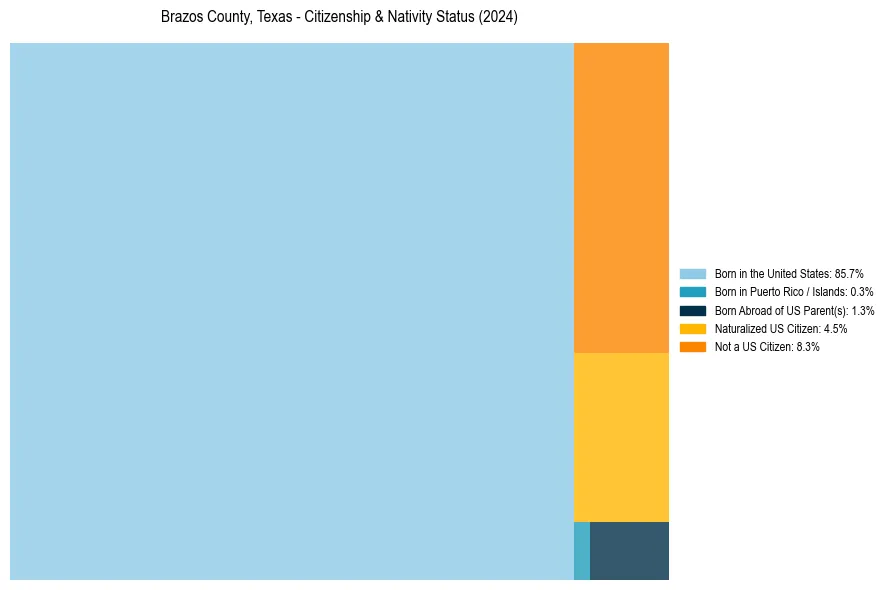
Brazos County, Texas Nativity & Citizenship Indicators (2024)
Native Born
87.2%
Foreign Born
12.8%
Naturalized
4.5%
US Citizens
91.7%
Brazos County, Texas Nativity & Citizenship Distribution
Brazos County, Texas Historical Nativity Trends (2010–2024)
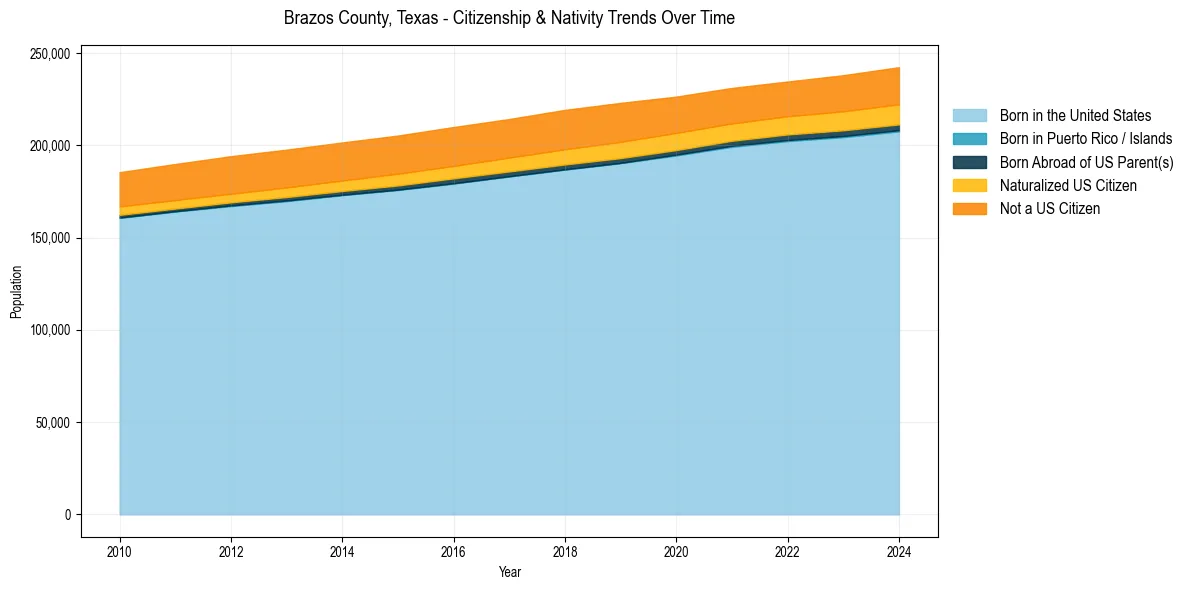
Brazos County, Texas Population & Nativity History
| Year | Total Pop | Foreign Born | Native Born |
|---|---|---|---|
| 2024 | 242,311 | 12.8% | 87.2% |
| 2023 | 237,980 | 12.5% | 87.5% |
| 2022 | 234,548 | 12.2% | 87.8% |
| 2021 | 231,095 | 12.4% | 87.6% |
| 2020 | 226,370 | 12.8% | 87.2% |
| 2019 | 222,981 | 13.4% | 86.6% |
| 2018 | 219,193 | 13.5% | 86.5% |
| 2017 | 214,231 | 13.3% | 86.7% |
| 2016 | 209,896 | 13.3% | 86.7% |
| 2015 | 205,271 | 13.2% | 86.8% |
| 2014 | 201,534 | 13.1% | 86.9% |
| 2013 | 197,642 | 13.0% | 87.0% |
| 2012 | 194,087 | 12.9% | 87.1% |
| 2011 | 189,858 | 12.7% | 87.3% |
| 2010 | 185,426 | 12.5% | 87.5% |
Nativity & Citizenship FAQs for Brazos County, Texas
Approximately 12.8% of residents in Brazos County, Texas were born outside the United States.
The vast majority of residents, roughly 91.7%, are U.S. citizens (including both native-born and naturalized citizens).