Brazoria County, Texas Nativity & Citizenship Status (2024)
Place of birth and citizenship status analysis for Brazoria County, Texas
Brazoria County, Texas Nativity & Citizenship Indicators (2024)
Native Born
85.4%
Foreign Born
14.6%
Naturalized
8.3%
US Citizens
93.7%
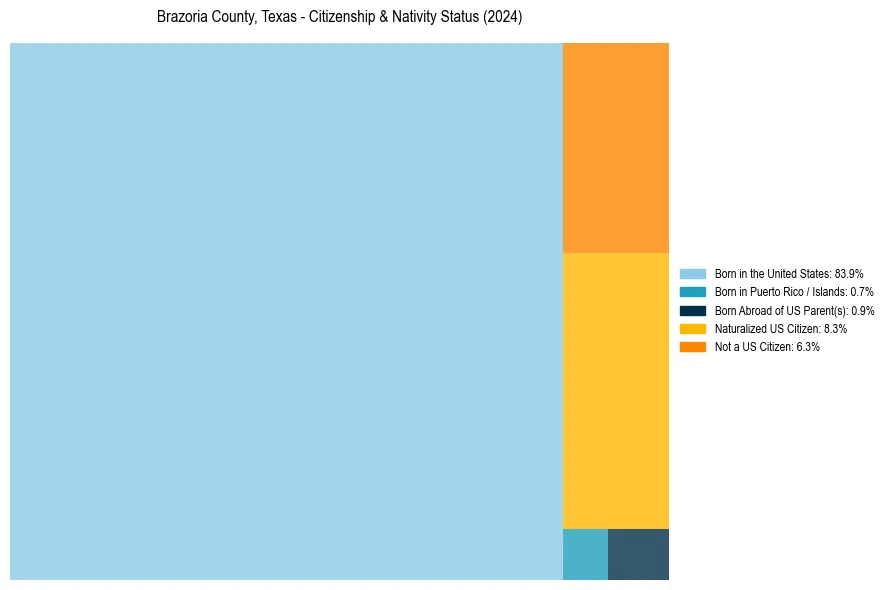
Brazoria County, Texas Nativity & Citizenship Distribution
Brazoria County, Texas Historical Nativity Trends (2010–2024)
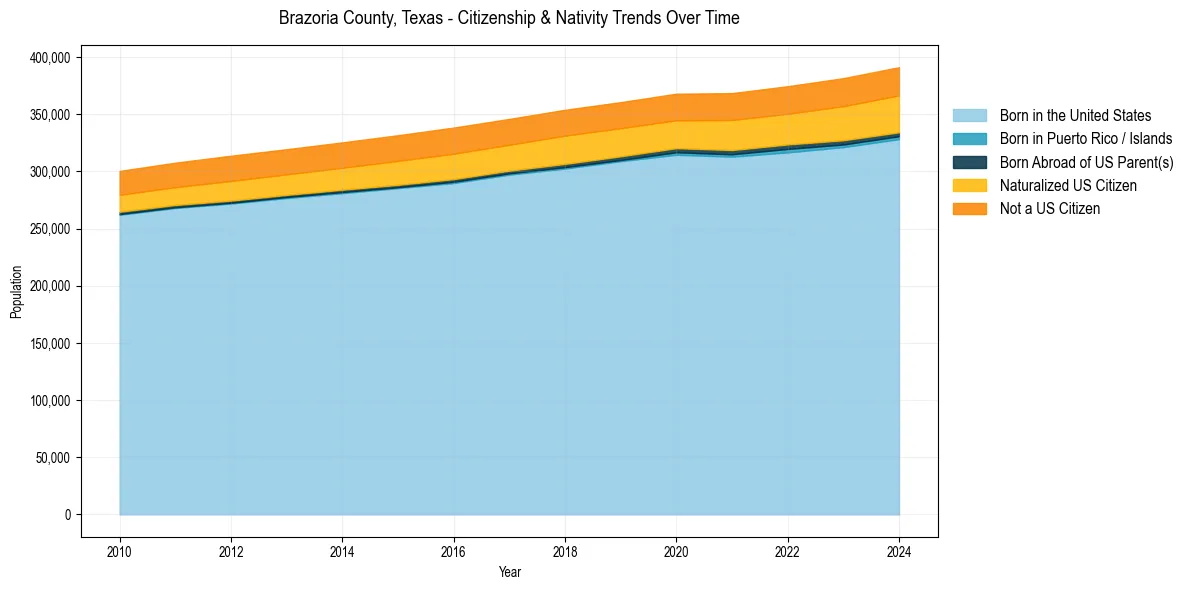
Brazoria County, Texas Population & Nativity History
| Year | Total Pop | Foreign Born | Native Born |
|---|---|---|---|
| 2024 | 391,255 | 14.6% | 85.4% |
| 2023 | 381,650 | 14.2% | 85.8% |
| 2022 | 374,600 | 13.6% | 86.4% |
| 2021 | 368,575 | 13.5% | 86.5% |
| 2020 | 368,062 | 13.0% | 87.0% |
| 2019 | 360,677 | 13.1% | 86.9% |
| 2018 | 353,999 | 13.4% | 86.6% |
| 2017 | 345,995 | 13.1% | 86.9% |
| 2016 | 338,419 | 13.3% | 86.7% |
| 2015 | 331,741 | 13.1% | 86.9% |
| 2014 | 325,477 | 12.7% | 87.3% |
| 2013 | 319,493 | 12.5% | 87.5% |
| 2012 | 313,813 | 12.5% | 87.5% |
| 2011 | 307,695 | 12.0% | 88.0% |
| 2010 | 300,522 | 11.9% | 88.1% |
Nativity & Citizenship FAQs for Brazoria County, Texas
Approximately 14.6% of residents in Brazoria County, Texas were born outside the United States.
The vast majority of residents, roughly 93.7%, are U.S. citizens (including both native-born and naturalized citizens).