Bexar County, Texas Nativity & Citizenship Status (2024)
Place of birth and citizenship status analysis for Bexar County, Texas
Bexar County, Texas Nativity & Citizenship Indicators (2024)
Native Born
86.2%
Foreign Born
13.8%
Naturalized
6.0%
US Citizens
92.2%
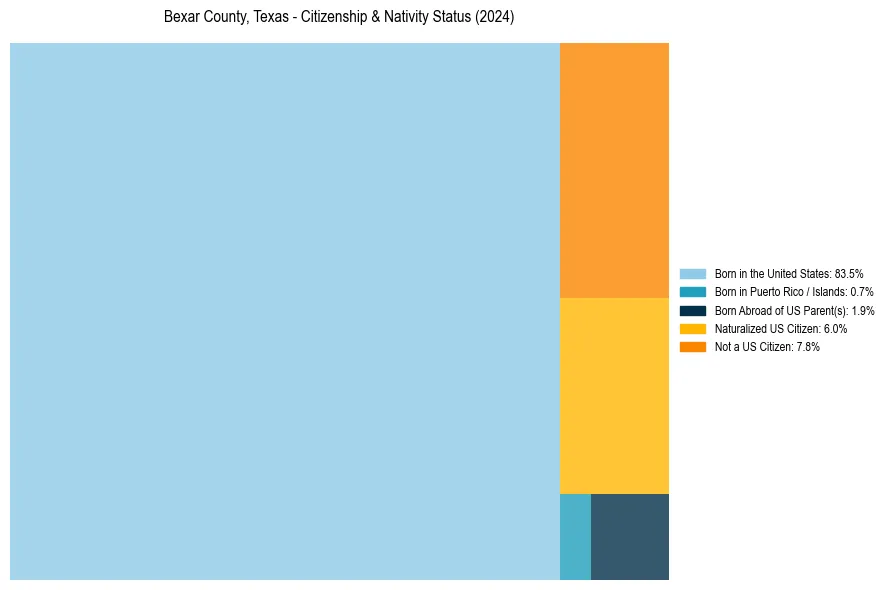
Bexar County, Texas Nativity & Citizenship Distribution
Bexar County, Texas Historical Nativity Trends (2010–2024)
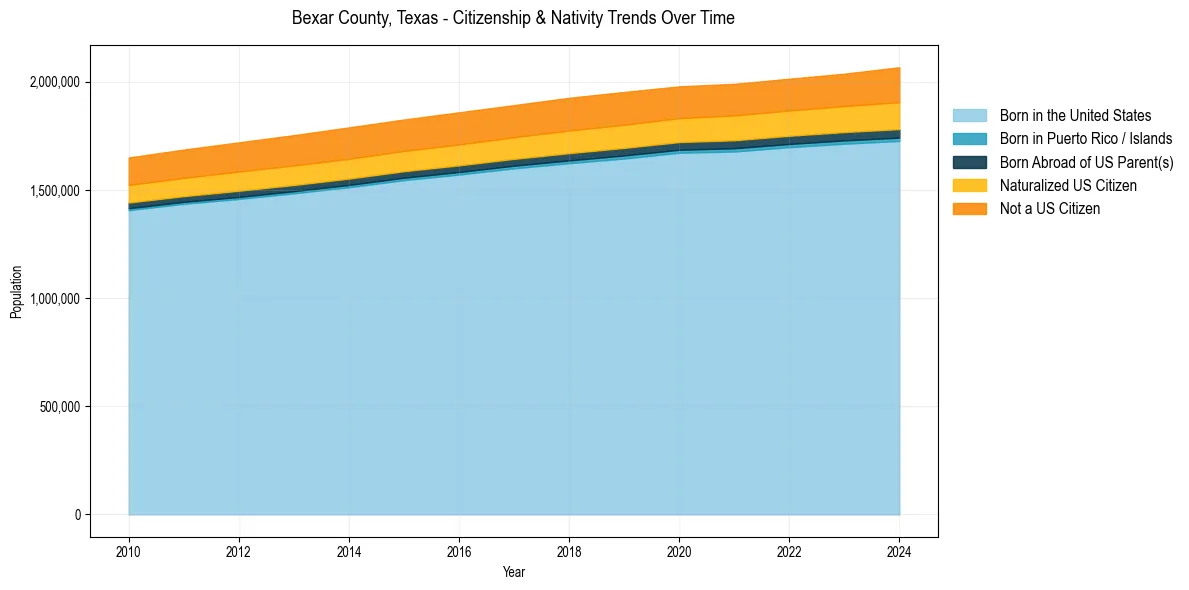
Bexar County, Texas Population & Nativity History
| Year | Total Pop | Foreign Born | Native Born |
|---|---|---|---|
| 2024 | 2,067,341 | 13.8% | 86.2% |
| 2023 | 2,037,344 | 13.3% | 86.7% |
| 2022 | 2,014,059 | 13.1% | 86.9% |
| 2021 | 1,990,522 | 13.1% | 86.9% |
| 2020 | 1,978,826 | 13.0% | 87.0% |
| 2019 | 1,952,843 | 13.2% | 86.8% |
| 2018 | 1,925,865 | 13.3% | 86.7% |
| 2017 | 1,892,004 | 13.1% | 86.9% |
| 2016 | 1,858,699 | 13.2% | 86.8% |
| 2015 | 1,825,502 | 13.1% | 86.9% |
| 2014 | 1,789,088 | 13.2% | 86.8% |
| 2013 | 1,753,238 | 13.1% | 86.9% |
| 2012 | 1,719,902 | 13.0% | 87.0% |
| 2011 | 1,686,452 | 12.8% | 87.2% |
| 2010 | 1,650,052 | 12.6% | 87.4% |
Nativity & Citizenship FAQs for Bexar County, Texas
Approximately 13.8% of residents in Bexar County, Texas were born outside the United States.
The vast majority of residents, roughly 92.2%, are U.S. citizens (including both native-born and naturalized citizens).