Bell County, Texas Nativity & Citizenship Status (2024)
Place of birth and citizenship status analysis for Bell County, Texas
Bell County, Texas Nativity & Citizenship Indicators (2024)
Native Born
91.4%
Foreign Born
8.6%
Naturalized
4.5%
US Citizens
95.9%
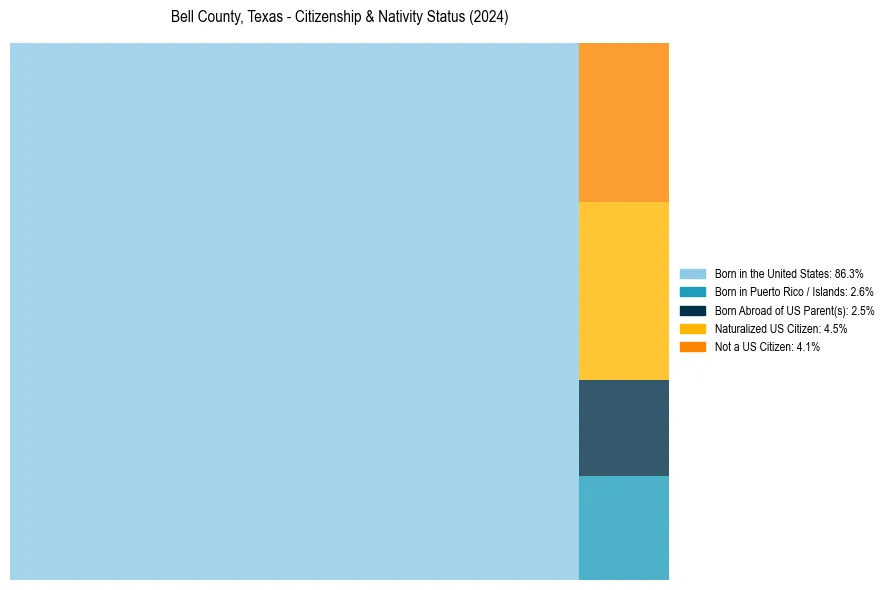
Bell County, Texas Nativity & Citizenship Distribution
Bell County, Texas Historical Nativity Trends (2010–2024)
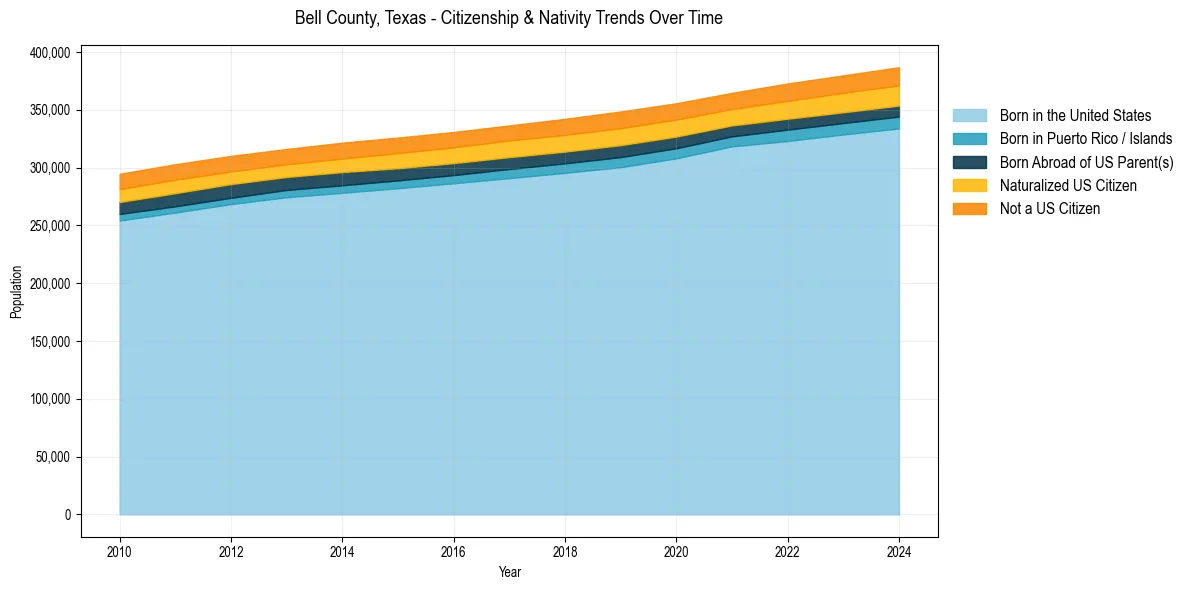
Bell County, Texas Population & Nativity History
| Year | Total Pop | Foreign Born | Native Born |
|---|---|---|---|
| 2024 | 386,897 | 8.6% | 91.4% |
| 2023 | 379,811 | 8.4% | 91.6% |
| 2022 | 372,821 | 8.2% | 91.8% |
| 2021 | 364,703 | 7.7% | 92.3% |
| 2020 | 355,700 | 8.1% | 91.9% |
| 2019 | 348,574 | 8.4% | 91.6% |
| 2018 | 342,236 | 8.3% | 91.7% |
| 2017 | 336,506 | 8.1% | 91.9% |
| 2016 | 330,859 | 8.1% | 91.9% |
| 2015 | 326,041 | 8.2% | 91.8% |
| 2014 | 321,591 | 7.9% | 92.1% |
| 2013 | 316,144 | 7.7% | 92.3% |
| 2012 | 310,155 | 7.9% | 92.1% |
| 2011 | 302,946 | 8.3% | 91.7% |
| 2010 | 294,689 | 8.3% | 91.7% |
Nativity & Citizenship FAQs for Bell County, Texas
Approximately 8.6% of residents in Bell County, Texas were born outside the United States.
The vast majority of residents, roughly 95.9%, are U.S. citizens (including both native-born and naturalized citizens).