Bastrop County, Texas Nativity & Citizenship Status (2024)
Place of birth and citizenship status analysis for Bastrop County, Texas
Bastrop County, Texas Nativity & Citizenship Indicators (2024)
Native Born
86.8%
Foreign Born
13.2%
Naturalized
3.9%
US Citizens
90.7%
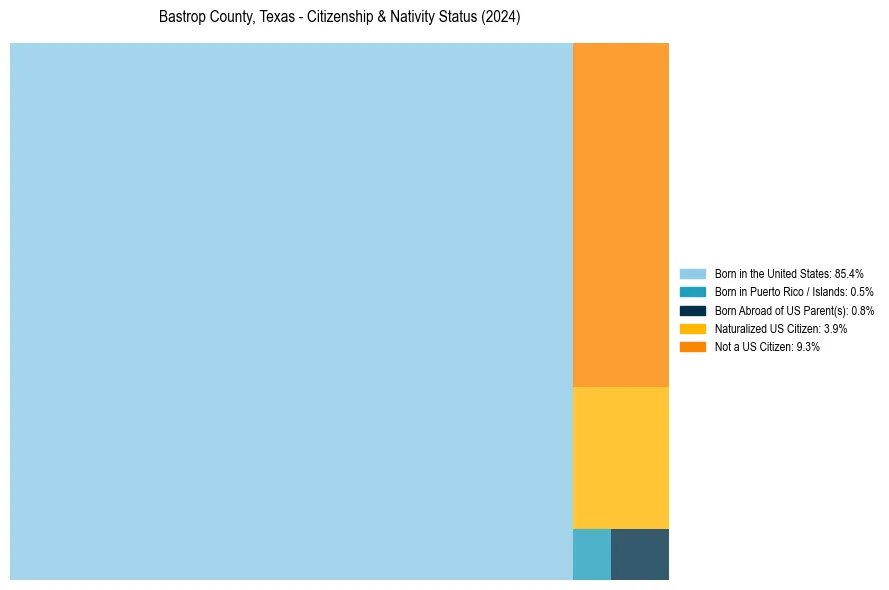
Bastrop County, Texas Nativity & Citizenship Distribution
Bastrop County, Texas Historical Nativity Trends (2010–2024)
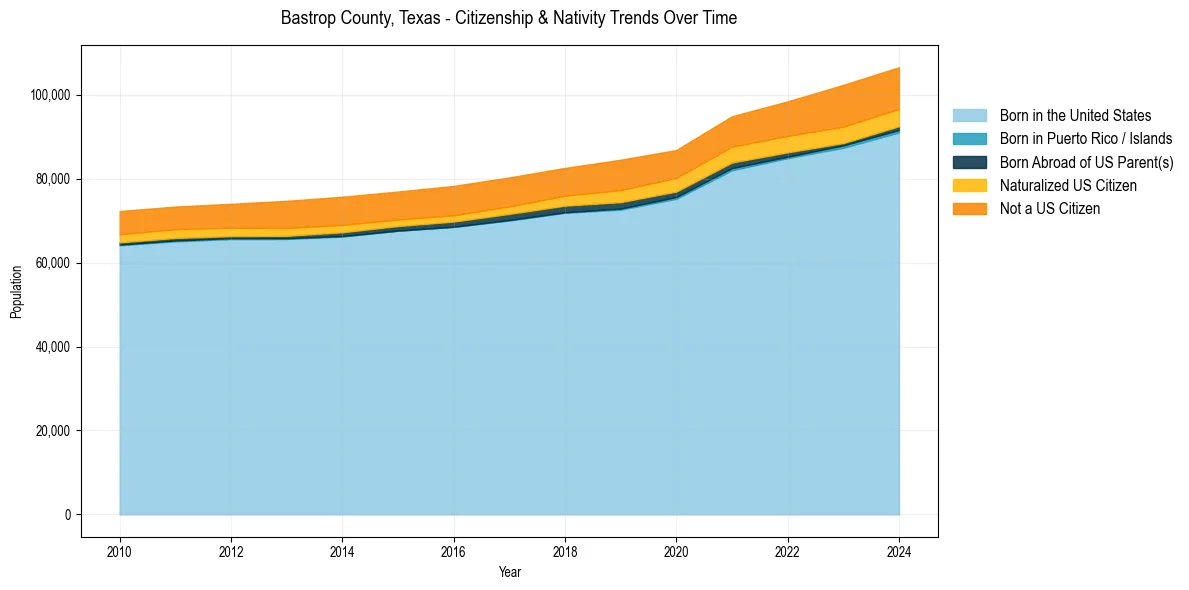
Bastrop County, Texas Population & Nativity History
| Year | Total Pop | Foreign Born | Native Born |
|---|---|---|---|
| 2024 | 106,582 | 13.2% | 86.8% |
| 2023 | 102,370 | 13.6% | 86.4% |
| 2022 | 98,435 | 12.3% | 87.7% |
| 2021 | 94,887 | 11.6% | 88.4% |
| 2020 | 86,839 | 11.4% | 88.6% |
| 2019 | 84,522 | 12.0% | 88.0% |
| 2018 | 82,577 | 10.9% | 89.1% |
| 2017 | 80,306 | 10.8% | 89.2% |
| 2016 | 78,286 | 10.9% | 89.1% |
| 2015 | 76,948 | 10.7% | 89.3% |
| 2014 | 75,708 | 11.2% | 88.8% |
| 2013 | 74,730 | 11.2% | 88.8% |
| 2012 | 74,023 | 10.4% | 89.6% |
| 2011 | 73,368 | 10.2% | 89.8% |
| 2010 | 72,289 | 10.3% | 89.7% |
Nativity & Citizenship FAQs for Bastrop County, Texas
Approximately 13.2% of residents in Bastrop County, Texas were born outside the United States.
The vast majority of residents, roughly 90.7%, are U.S. citizens (including both native-born and naturalized citizens).