Maury County, Tennessee Nativity & Citizenship Status (2024)
Place of birth and citizenship status analysis for Maury County, Tennessee
Maury County, Tennessee Nativity & Citizenship Indicators (2024)
Native Born
96.1%
Foreign Born
3.9%
Naturalized
1.4%
US Citizens
97.6%
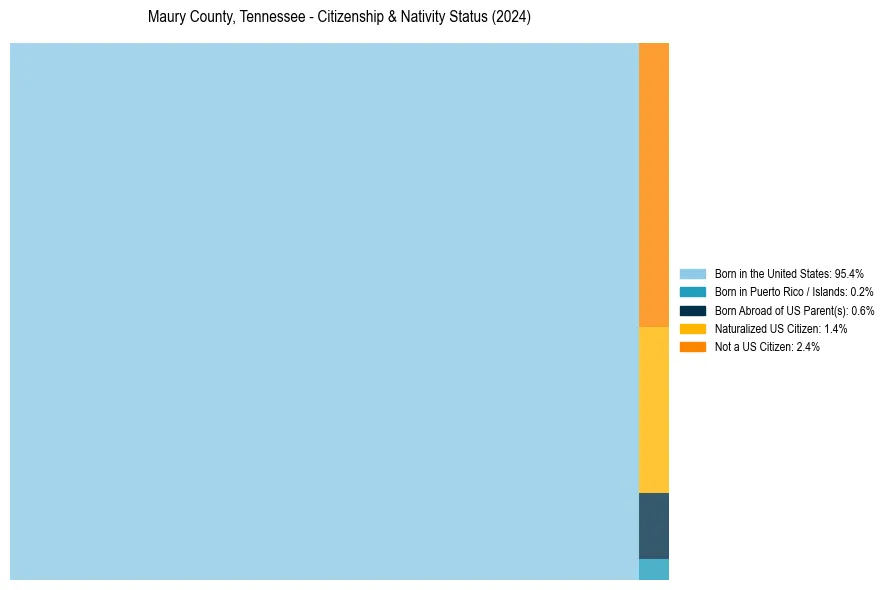
Maury County, Tennessee Nativity & Citizenship Distribution
Maury County, Tennessee Historical Nativity Trends (2010–2024)
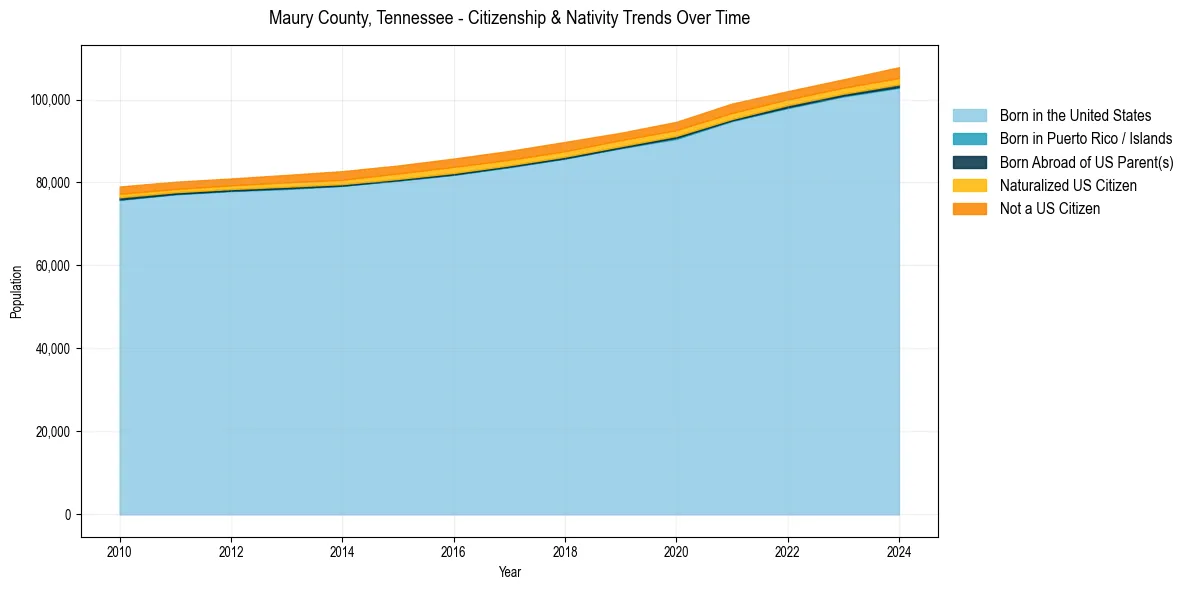
Maury County, Tennessee Population & Nativity History
| Year | Total Pop | Foreign Born | Native Born |
|---|---|---|---|
| 2024 | 107,791 | 3.9% | 96.1% |
| 2023 | 104,855 | 3.3% | 96.7% |
| 2022 | 102,002 | 3.3% | 96.7% |
| 2021 | 99,011 | 3.8% | 96.2% |
| 2020 | 94,615 | 3.6% | 96.4% |
| 2019 | 91,976 | 3.5% | 96.5% |
| 2018 | 89,776 | 4.0% | 96.0% |
| 2017 | 87,606 | 4.0% | 96.0% |
| 2016 | 85,767 | 4.1% | 95.9% |
| 2015 | 84,089 | 3.9% | 96.1% |
| 2014 | 82,729 | 3.8% | 96.2% |
| 2013 | 81,821 | 3.5% | 96.5% |
| 2012 | 80,965 | 3.1% | 96.9% |
| 2011 | 80,177 | 3.2% | 96.8% |
| 2010 | 79,029 | 3.3% | 96.7% |
Nativity & Citizenship FAQs for Maury County, Tennessee
Approximately 3.9% of residents in Maury County, Tennessee were born outside the United States.
The vast majority of residents, roughly 97.6%, are U.S. citizens (including both native-born and naturalized citizens).