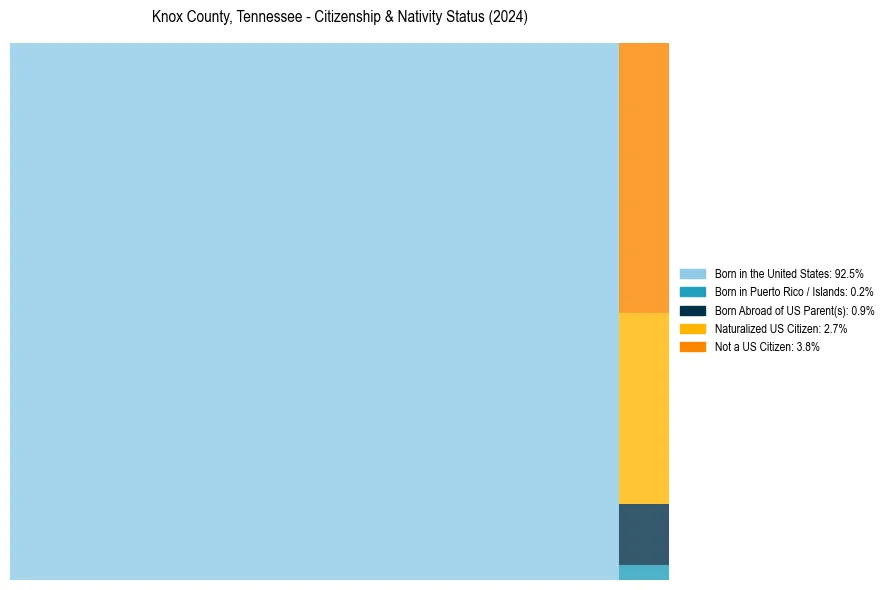
Knox County, Tennessee Nativity & Citizenship Status (2024)
Place of birth and citizenship status analysis for Knox County, Tennessee
Knox County, Tennessee Nativity & Citizenship Indicators (2024)
Native Born
93.5%
Foreign Born
6.5%
Naturalized
2.7%
US Citizens
96.2%
Knox County, Tennessee Nativity & Citizenship Distribution
Knox County, Tennessee Historical Nativity Trends (2010–2024)
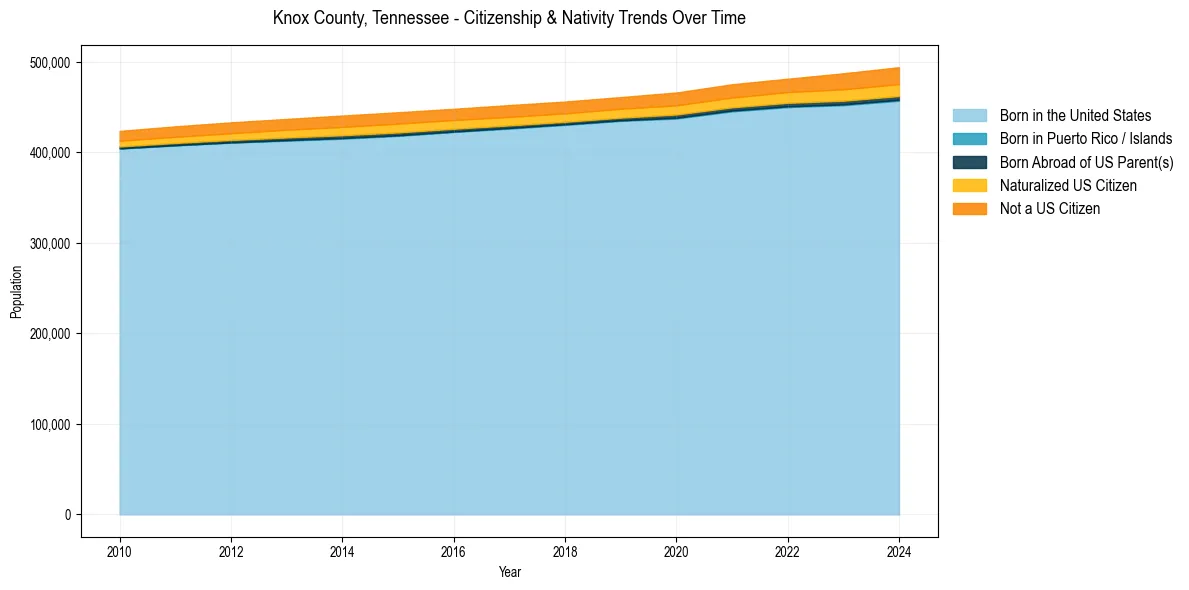
Knox County, Tennessee Population & Nativity History
| Year | Total Pop | Foreign Born | Native Born |
|---|---|---|---|
| 2024 | 494,148 | 6.5% | 93.5% |
| 2023 | 487,401 | 6.2% | 93.8% |
| 2022 | 481,406 | 5.5% | 94.5% |
| 2021 | 475,286 | 5.4% | 94.6% |
| 2020 | 466,184 | 5.2% | 94.8% |
| 2019 | 461,104 | 4.9% | 95.1% |
| 2018 | 456,185 | 4.9% | 95.1% |
| 2017 | 452,286 | 5.0% | 95.0% |
| 2016 | 448,164 | 4.9% | 95.1% |
| 2015 | 444,348 | 5.0% | 95.0% |
| 2014 | 440,732 | 4.9% | 95.1% |
| 2013 | 436,983 | 4.7% | 95.3% |
| 2012 | 433,207 | 4.5% | 95.5% |
| 2011 | 428,777 | 4.3% | 95.7% |
| 2010 | 423,748 | 4.0% | 96.0% |
Nativity & Citizenship FAQs for Knox County, Tennessee
Approximately 6.5% of residents in Knox County, Tennessee were born outside the United States.
The vast majority of residents, roughly 96.2%, are U.S. citizens (including both native-born and naturalized citizens).