Hamilton County, Tennessee Nativity & Citizenship Status (2024)
Place of birth and citizenship status analysis for Hamilton County, Tennessee
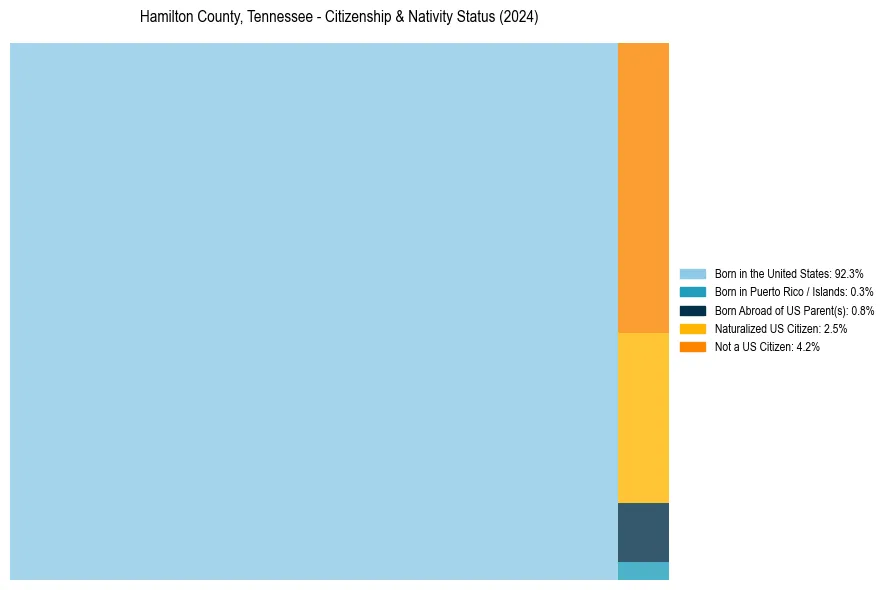
Hamilton County, Tennessee Nativity & Citizenship Indicators (2024)
Native Born
93.4%
Foreign Born
6.6%
Naturalized
2.5%
US Citizens
95.8%
Hamilton County, Tennessee Nativity & Citizenship Distribution
Hamilton County, Tennessee Historical Nativity Trends (2010–2024)
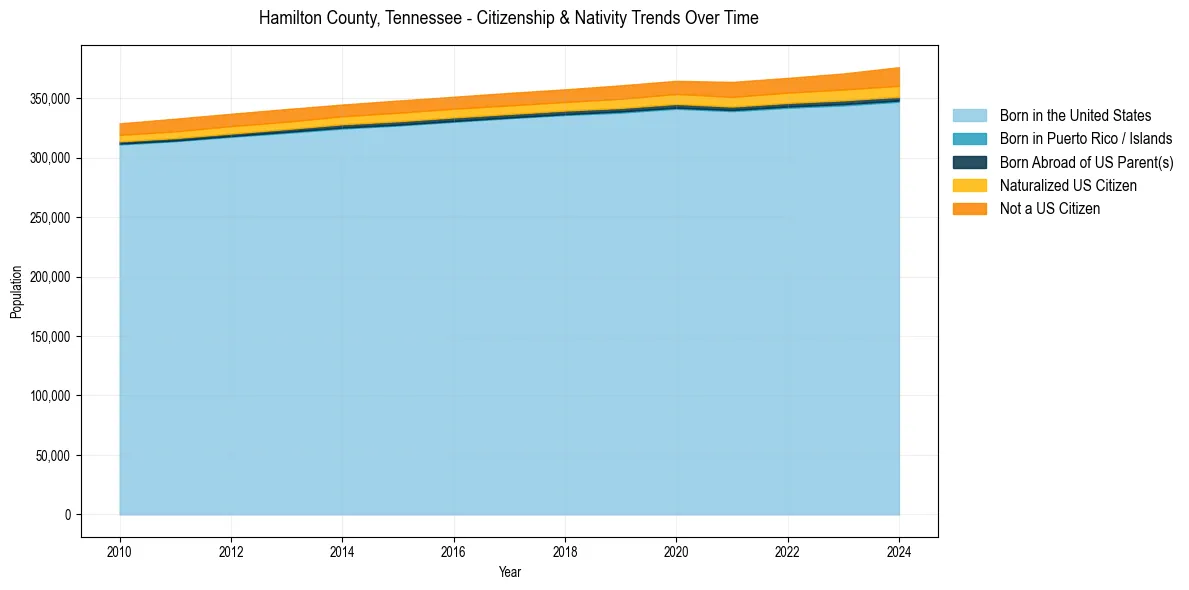
Hamilton County, Tennessee Population & Nativity History
| Year | Total Pop | Foreign Born | Native Born |
|---|---|---|---|
| 2024 | 376,192 | 6.6% | 93.4% |
| 2023 | 370,913 | 6.1% | 93.9% |
| 2022 | 367,193 | 5.7% | 94.3% |
| 2021 | 363,790 | 5.7% | 94.3% |
| 2020 | 364,718 | 5.3% | 94.7% |
| 2019 | 360,919 | 5.3% | 94.7% |
| 2018 | 357,546 | 5.0% | 95.0% |
| 2017 | 354,589 | 5.0% | 95.0% |
| 2016 | 351,305 | 4.9% | 95.1% |
| 2015 | 348,121 | 5.0% | 95.0% |
| 2014 | 344,772 | 4.8% | 95.2% |
| 2013 | 340,973 | 4.9% | 95.1% |
| 2012 | 337,023 | 4.9% | 95.1% |
| 2011 | 332,863 | 4.9% | 95.1% |
| 2010 | 328,960 | 4.6% | 95.4% |
Nativity & Citizenship FAQs for Hamilton County, Tennessee
Approximately 6.6% of residents in Hamilton County, Tennessee were born outside the United States.
The vast majority of residents, roughly 95.8%, are U.S. citizens (including both native-born and naturalized citizens).