Franklin County, Tennessee Nativity & Citizenship Status (2024)
Place of birth and citizenship status analysis for Franklin County, Tennessee
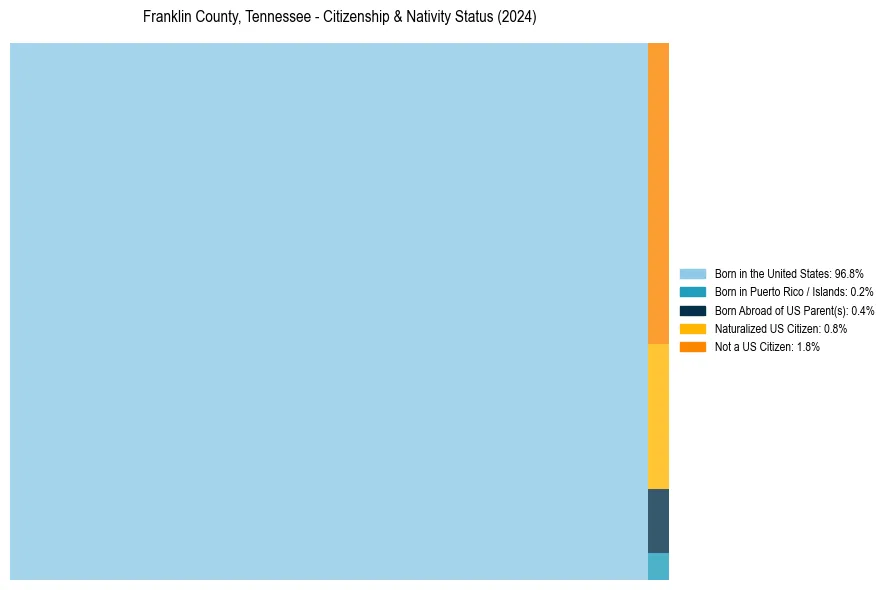
Franklin County, Tennessee Nativity & Citizenship Indicators (2024)
Native Born
97.4%
Foreign Born
2.6%
Naturalized
0.8%
US Citizens
98.2%
Franklin County, Tennessee Nativity & Citizenship Distribution
Franklin County, Tennessee Historical Nativity Trends (2010–2024)
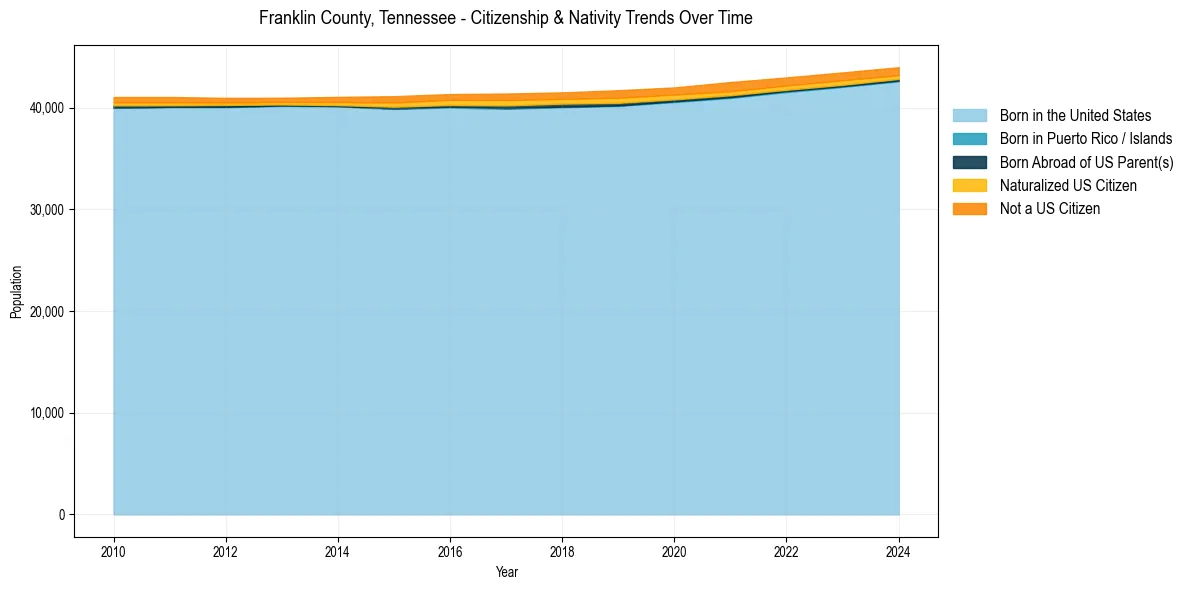
Franklin County, Tennessee Population & Nativity History
| Year | Total Pop | Foreign Born | Native Born |
|---|---|---|---|
| 2024 | 43,990 | 2.6% | 97.4% |
| 2023 | 43,478 | 2.8% | 97.2% |
| 2022 | 42,980 | 2.8% | 97.2% |
| 2021 | 42,528 | 3.0% | 97.0% |
| 2020 | 41,999 | 2.8% | 97.2% |
| 2019 | 41,725 | 3.0% | 97.0% |
| 2018 | 41,512 | 2.7% | 97.3% |
| 2017 | 41,397 | 2.8% | 97.2% |
| 2016 | 41,348 | 2.6% | 97.4% |
| 2015 | 41,138 | 2.5% | 97.5% |
| 2014 | 41,069 | 2.0% | 98.0% |
| 2013 | 40,985 | 1.6% | 98.4% |
| 2012 | 40,972 | 1.7% | 98.3% |
| 2011 | 41,058 | 2.0% | 98.0% |
| 2010 | 41,054 | 2.0% | 98.0% |
Nativity & Citizenship FAQs for Franklin County, Tennessee
Approximately 2.6% of residents in Franklin County, Tennessee were born outside the United States.
The vast majority of residents, roughly 98.2%, are U.S. citizens (including both native-born and naturalized citizens).