Davidson County, Tennessee Nativity & Citizenship Status (2024)
Place of birth and citizenship status analysis for Davidson County, Tennessee
Davidson County, Tennessee Nativity & Citizenship Indicators (2024)
Native Born
85.0%
Foreign Born
15.0%
Naturalized
5.6%
US Citizens
90.6%
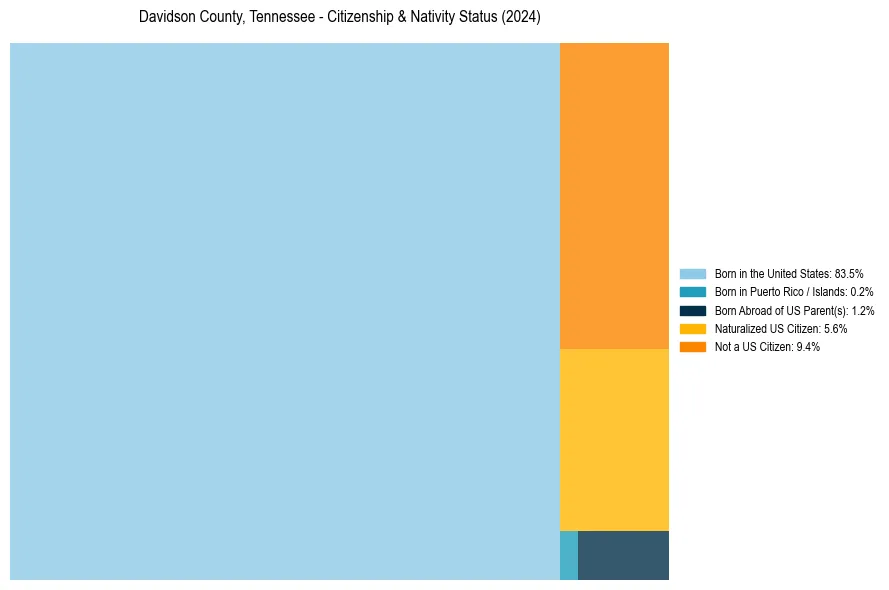
Davidson County, Tennessee Nativity & Citizenship Distribution
Davidson County, Tennessee Historical Nativity Trends (2010–2024)
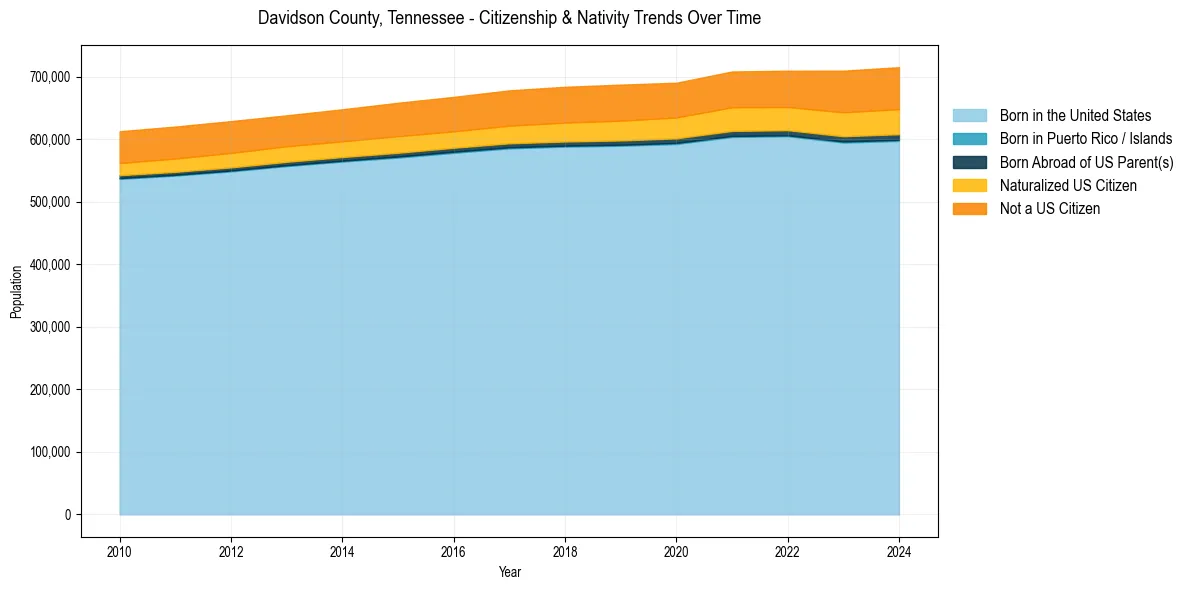
Davidson County, Tennessee Population & Nativity History
| Year | Total Pop | Foreign Born | Native Born |
|---|---|---|---|
| 2024 | 715,388 | 15.0% | 85.0% |
| 2023 | 709,846 | 14.8% | 85.2% |
| 2022 | 709,786 | 13.4% | 86.6% |
| 2021 | 708,490 | 13.4% | 86.6% |
| 2020 | 690,540 | 12.9% | 87.1% |
| 2019 | 687,488 | 13.0% | 87.0% |
| 2018 | 684,017 | 12.8% | 87.2% |
| 2017 | 678,322 | 12.5% | 87.5% |
| 2016 | 667,885 | 12.2% | 87.8% |
| 2015 | 658,506 | 12.2% | 87.8% |
| 2014 | 648,048 | 11.8% | 88.2% |
| 2013 | 638,395 | 11.7% | 88.3% |
| 2012 | 629,113 | 11.8% | 88.2% |
| 2011 | 620,443 | 11.7% | 88.3% |
| 2010 | 612,884 | 11.5% | 88.5% |
Nativity & Citizenship FAQs for Davidson County, Tennessee
Approximately 15.0% of residents in Davidson County, Tennessee were born outside the United States.
The vast majority of residents, roughly 90.6%, are U.S. citizens (including both native-born and naturalized citizens).