Davidson County, Tennessee Health Insurance Coverage (2024)
Detailed analysis of uninsured rates and coverage trends for Davidson County, Tennessee
Universe
710,040
Total Uninsured
89,025
Uninsured Rate
12.5%
Coverage by Age and Gender
Distribution of insured vs. uninsured residents in Davidson County, Tennessee
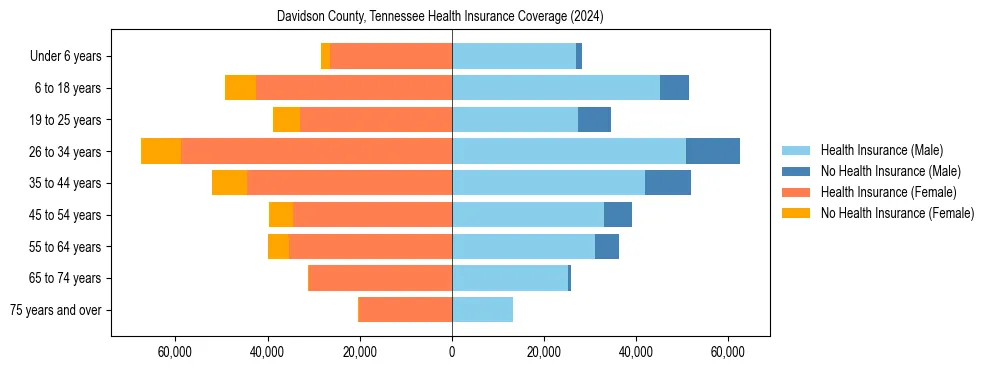
Uninsured Rates by Demographic Group
Under 18 Years
Male Uninsured9.3%
Female Uninsured11.1%
18 to 34 Years
Male Uninsured19.4%
Female Uninsured13.5%
35 to 64 Years
Male Uninsured16.8%
Female Uninsured13.2%
65 Years & Over
Male Uninsured1.6%
Female Uninsured0.9%
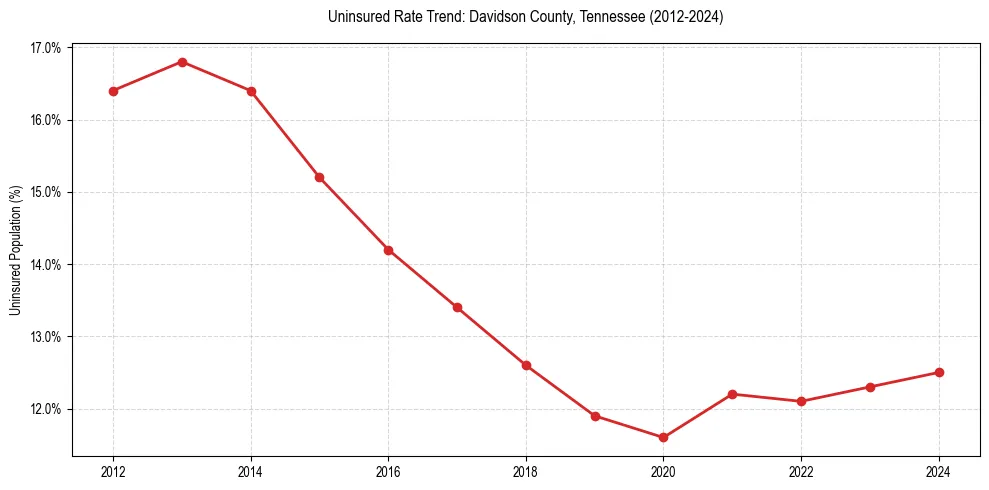
Uninsured Rate Trends
Historical coverage data from 2012 to 2024
| Year | Total Uninsured | Uninsured Rate |
|---|---|---|
| 2024 | 89,025 | 12.5% |
| 2023 | 86,914 | 12.3% |
| 2022 | 85,374 | 12.1% |
| 2021 | 85,802 | 12.2% |
| 2020 | 79,478 | 11.6% |
| 2019 | 81,087 | 11.9% |
| 2018 | 85,347 | 12.6% |
| 2017 | 90,104 | 13.4% |
| 2016 | 93,741 | 14.2% |
| 2015 | 99,100 | 15.2% |
| 2014 | 104,849 | 16.4% |
| 2013 | 105,634 | 16.8% |
| 2012 | 101,743 | 16.4% |
Frequently Asked Questions
Approximately 12.5% of the population in Davidson County, Tennessee does not have health insurance coverage.
In Davidson County, Tennessee, young adult males (18-34) face the highest barrier to coverage, with an uninsured rate of 19.4%. This is notably higher than the overall local average of 12.5%.