Potter County, South Dakota Nativity & Citizenship Status (2024)
Place of birth and citizenship status analysis for Potter County, South Dakota
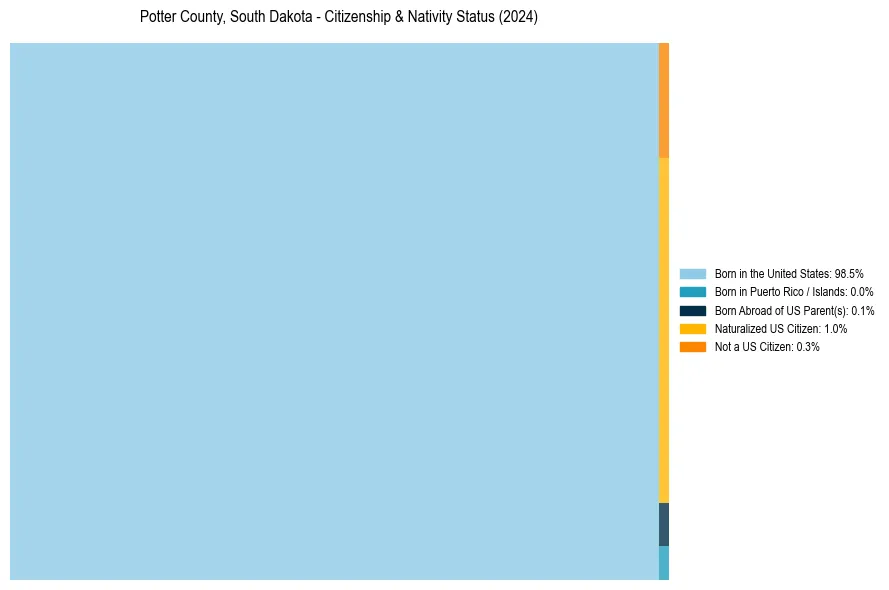
Potter County, South Dakota Nativity & Citizenship Indicators (2024)
Native Born
98.7%
Foreign Born
1.3%
Naturalized
1.0%
US Citizens
99.7%
Potter County, South Dakota Nativity & Citizenship Distribution
Potter County, South Dakota Historical Nativity Trends (2010–2024)
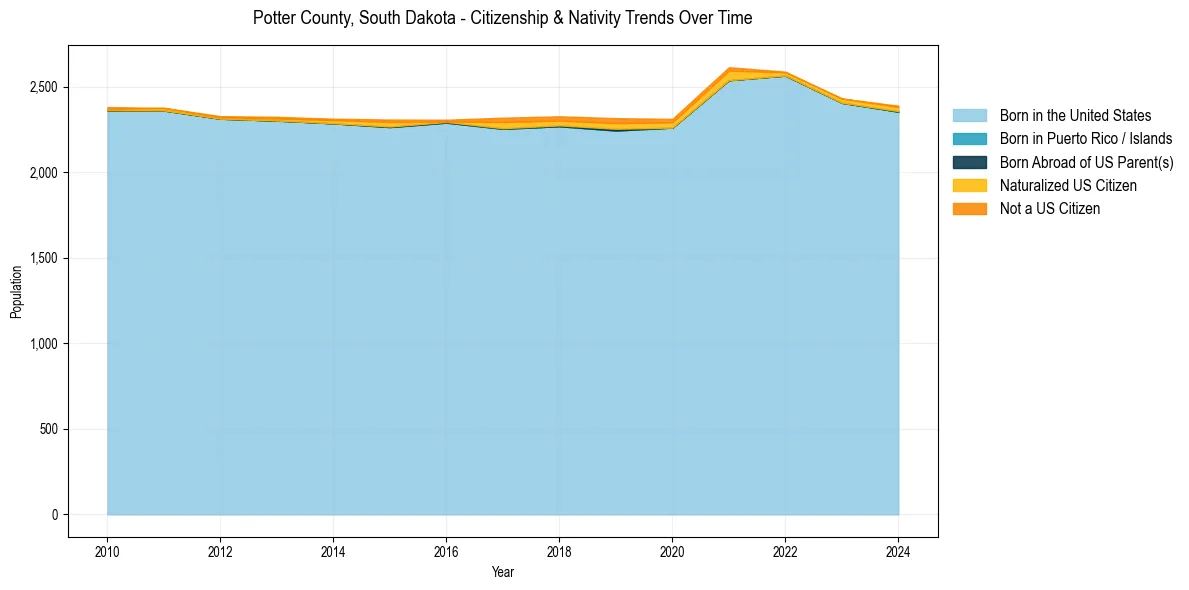
Potter County, South Dakota Population & Nativity History
| Year | Total Pop | Foreign Born | Native Born |
|---|---|---|---|
| 2024 | 2,388 | 1.3% | 98.7% |
| 2023 | 2,430 | 1.0% | 99.0% |
| 2022 | 2,587 | 0.9% | 99.1% |
| 2021 | 2,613 | 2.9% | 97.1% |
| 2020 | 2,311 | 2.2% | 97.8% |
| 2019 | 2,315 | 2.7% | 97.3% |
| 2018 | 2,326 | 2.3% | 97.7% |
| 2017 | 2,318 | 2.7% | 97.3% |
| 2016 | 2,306 | 0.6% | 99.4% |
| 2015 | 2,307 | 1.8% | 98.2% |
| 2014 | 2,312 | 1.2% | 98.8% |
| 2013 | 2,323 | 0.9% | 99.1% |
| 2012 | 2,327 | 0.6% | 99.4% |
| 2011 | 2,375 | 0.6% | 99.4% |
| 2010 | 2,380 | 0.8% | 99.2% |
Nativity & Citizenship FAQs for Potter County, South Dakota
Approximately 1.3% of residents in Potter County, South Dakota were born outside the United States.
The vast majority of residents, roughly 99.7%, are U.S. citizens (including both native-born and naturalized citizens).