Pennington County, South Dakota Nativity & Citizenship Status (2024)
Place of birth and citizenship status analysis for Pennington County, South Dakota
Pennington County, South Dakota Nativity & Citizenship Indicators (2024)
Native Born
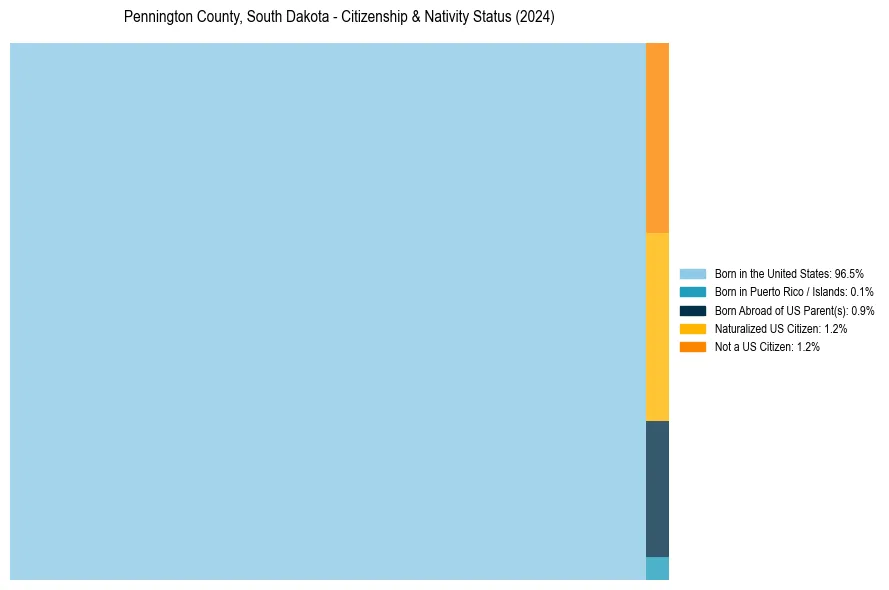
97.5%
Foreign Born
2.5%
Naturalized
1.2%
US Citizens
98.8%
Pennington County, South Dakota Nativity & Citizenship Distribution
Pennington County, South Dakota Historical Nativity Trends (2010–2024)
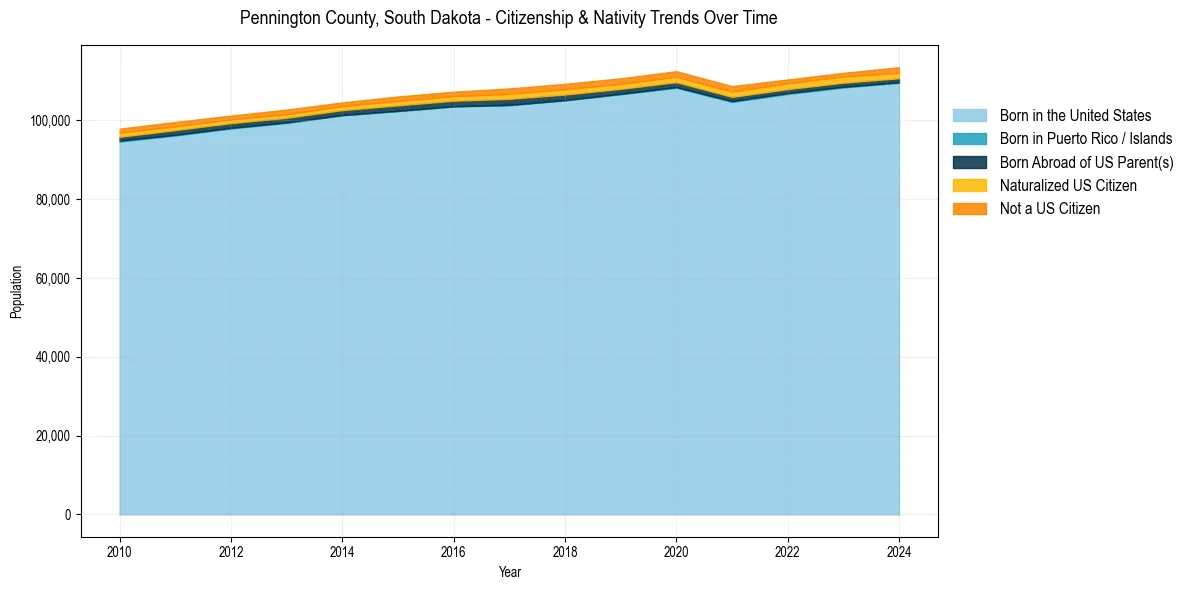
Pennington County, South Dakota Population & Nativity History
| Year | Total Pop | Foreign Born | Native Born |
|---|---|---|---|
| 2024 | 113,512 | 2.5% | 97.5% |
| 2023 | 112,081 | 2.2% | 97.8% |
| 2022 | 110,386 | 2.2% | 97.8% |
| 2021 | 108,707 | 2.5% | 97.5% |
| 2020 | 112,504 | 2.5% | 97.5% |
| 2019 | 110,685 | 2.4% | 97.6% |
| 2018 | 109,294 | 2.5% | 97.5% |
| 2017 | 108,126 | 2.5% | 97.5% |
| 2016 | 107,298 | 2.1% | 97.9% |
| 2015 | 106,085 | 2.1% | 97.9% |
| 2014 | 104,574 | 1.9% | 98.1% |
| 2013 | 102,752 | 2.0% | 98.0% |
| 2012 | 101,240 | 1.9% | 98.1% |
| 2011 | 99,611 | 2.1% | 97.9% |
| 2010 | 97,922 | 2.1% | 97.9% |
Nativity & Citizenship FAQs for Pennington County, South Dakota
Approximately 2.5% of residents in Pennington County, South Dakota were born outside the United States.
The vast majority of residents, roughly 98.8%, are U.S. citizens (including both native-born and naturalized citizens).