Minnehaha County, South Dakota Nativity & Citizenship Status (2024)
Place of birth and citizenship status analysis for Minnehaha County, South Dakota
Minnehaha County, South Dakota Nativity & Citizenship Indicators (2024)
Native Born
92.4%
Foreign Born
7.6%
Naturalized
3.5%
US Citizens
95.9%
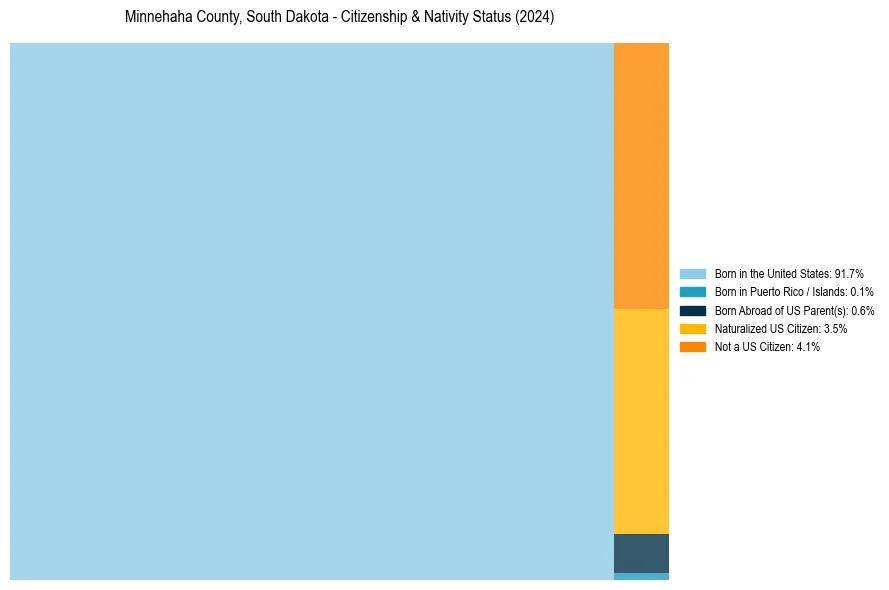
Minnehaha County, South Dakota Nativity & Citizenship Distribution
Minnehaha County, South Dakota Historical Nativity Trends (2010–2024)
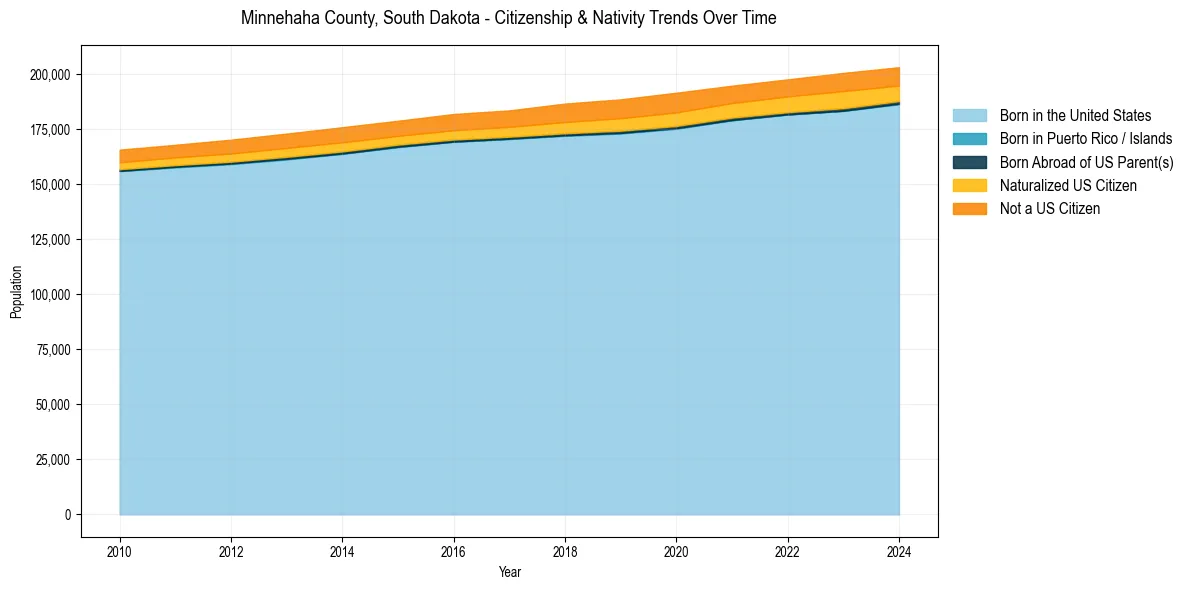
Minnehaha County, South Dakota Population & Nativity History
| Year | Total Pop | Foreign Born | Native Born |
|---|---|---|---|
| 2024 | 203,289 | 7.6% | 92.4% |
| 2023 | 200,689 | 8.0% | 92.0% |
| 2022 | 197,742 | 7.5% | 92.5% |
| 2021 | 194,884 | 7.4% | 92.6% |
| 2020 | 191,682 | 7.9% | 92.1% |
| 2019 | 188,674 | 7.6% | 92.4% |
| 2018 | 186,749 | 7.2% | 92.8% |
| 2017 | 183,660 | 6.5% | 93.5% |
| 2016 | 182,014 | 6.4% | 93.6% |
| 2015 | 178,942 | 6.1% | 93.9% |
| 2014 | 176,014 | 6.3% | 93.7% |
| 2013 | 173,108 | 6.1% | 93.9% |
| 2012 | 170,342 | 5.9% | 94.1% |
| 2011 | 168,014 | 5.5% | 94.5% |
| 2010 | 165,799 | 5.3% | 94.7% |
Nativity & Citizenship FAQs for Minnehaha County, South Dakota
Approximately 7.6% of residents in Minnehaha County, South Dakota were born outside the United States.
The vast majority of residents, roughly 95.9%, are U.S. citizens (including both native-born and naturalized citizens).