Lincoln County, South Dakota Nativity & Citizenship Status (2024)
Place of birth and citizenship status analysis for Lincoln County, South Dakota
Lincoln County, South Dakota Nativity & Citizenship Indicators (2024)
Native Born
95.1%
Foreign Born
4.9%
Naturalized
2.5%
US Citizens
97.6%
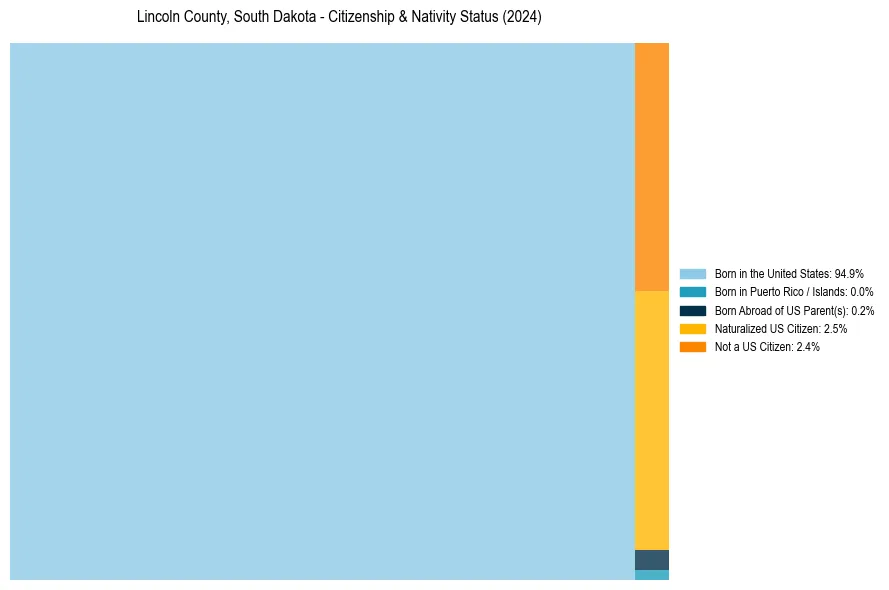
Lincoln County, South Dakota Nativity & Citizenship Distribution
Lincoln County, South Dakota Historical Nativity Trends (2010–2024)
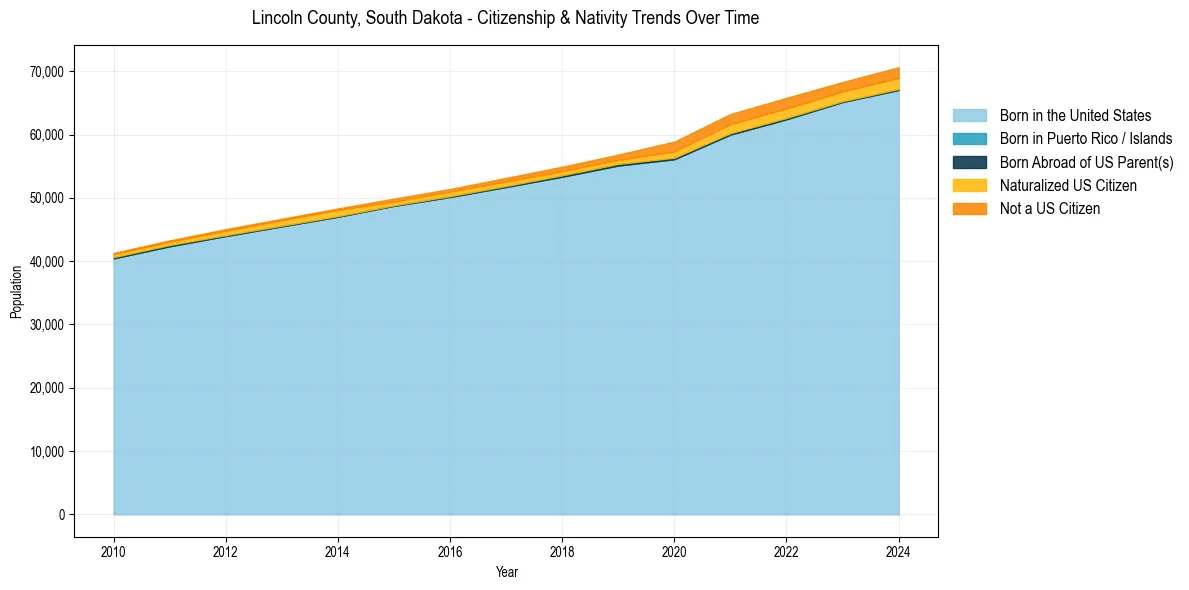
Lincoln County, South Dakota Population & Nativity History
| Year | Total Pop | Foreign Born | Native Born |
|---|---|---|---|
| 2024 | 70,638 | 4.9% | 95.1% |
| 2023 | 68,286 | 4.4% | 95.6% |
| 2022 | 65,801 | 4.8% | 95.2% |
| 2021 | 63,233 | 4.8% | 95.2% |
| 2020 | 58,887 | 4.3% | 95.7% |
| 2019 | 56,826 | 2.6% | 97.4% |
| 2018 | 54,914 | 2.5% | 97.5% |
| 2017 | 53,147 | 2.4% | 97.6% |
| 2016 | 51,396 | 2.2% | 97.8% |
| 2015 | 49,874 | 2.1% | 97.9% |
| 2014 | 48,326 | 2.5% | 97.5% |
| 2013 | 46,693 | 2.3% | 97.7% |
| 2012 | 45,055 | 2.1% | 97.9% |
| 2011 | 43,276 | 1.7% | 98.3% |
| 2010 | 41,289 | 1.6% | 98.4% |
Nativity & Citizenship FAQs for Lincoln County, South Dakota
Approximately 4.9% of residents in Lincoln County, South Dakota were born outside the United States.
The vast majority of residents, roughly 97.6%, are U.S. citizens (including both native-born and naturalized citizens).