Buffalo County, South Dakota Health Insurance Coverage (2024)
Detailed analysis of uninsured rates and coverage trends for Buffalo County, South Dakota
Universe
1,808
Total Uninsured
777
Uninsured Rate
43.0%
Coverage by Age and Gender
Distribution of insured vs. uninsured residents in Buffalo County, South Dakota
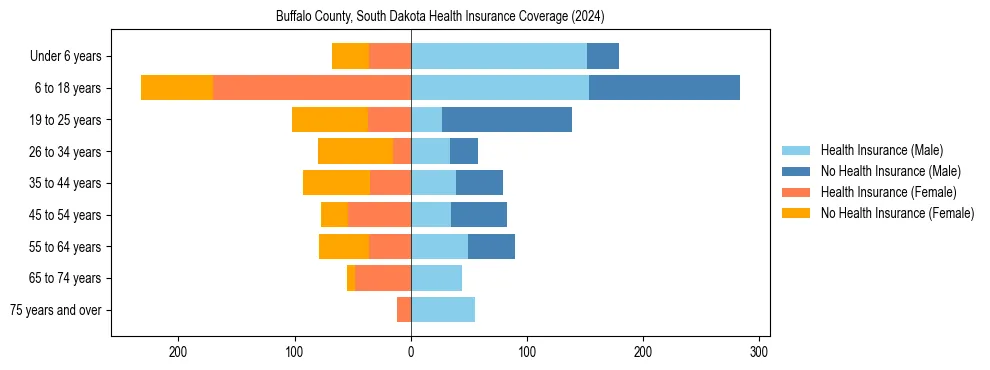
Uninsured Rates by Demographic Group
Under 18 Years
Male Uninsured34.0%
Female Uninsured31.3%
18 to 34 Years
Male Uninsured69.0%
Female Uninsured71.4%
35 to 64 Years
Male Uninsured51.2%
Female Uninsured49.8%
65 Years & Over
Male Uninsured0.0%
Female Uninsured10.4%
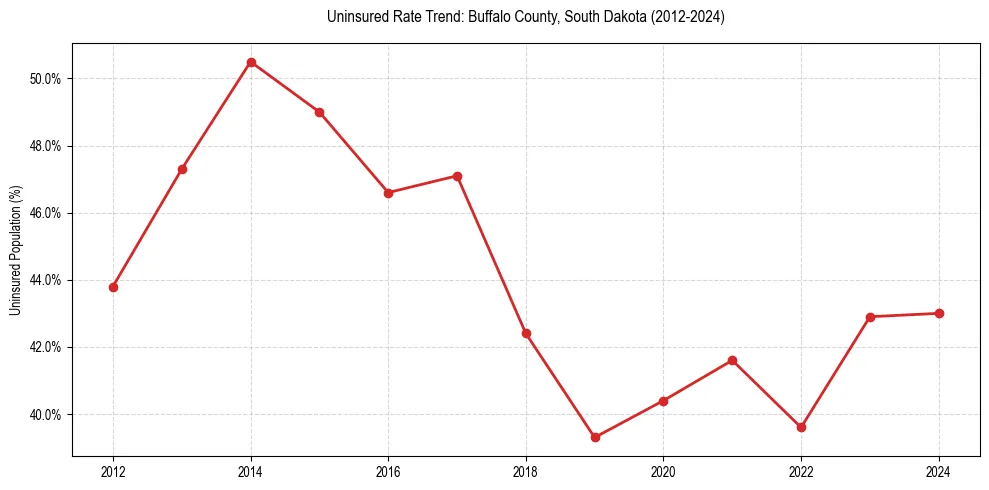
Uninsured Rate Trends
Historical coverage data from 2012 to 2024
| Year | Total Uninsured | Uninsured Rate |
|---|---|---|
| 2024 | 777 | 43.0% |
| 2023 | 754 | 42.9% |
| 2022 | 737 | 39.6% |
| 2021 | 821 | 41.6% |
| 2020 | 810 | 40.4% |
| 2019 | 796 | 39.3% |
| 2018 | 870 | 42.4% |
| 2017 | 964 | 47.1% |
| 2016 | 956 | 46.6% |
| 2015 | 998 | 49.0% |
| 2014 | 1,017 | 50.5% |
| 2013 | 930 | 47.3% |
| 2012 | 854 | 43.8% |
Frequently Asked Questions
Approximately 43.0% of the population in Buffalo County, South Dakota does not have health insurance coverage.
In Buffalo County, South Dakota, young adult females (18-34) face the highest barrier to coverage, with an uninsured rate of 71.4%. This is notably higher than the overall local average of 43.0%.