Brookings County, South Dakota Nativity & Citizenship Status (2024)
Place of birth and citizenship status analysis for Brookings County, South Dakota
Brookings County, South Dakota Nativity & Citizenship Indicators (2024)
Native Born
93.8%
Foreign Born
6.2%
Naturalized
1.7%
US Citizens
95.5%
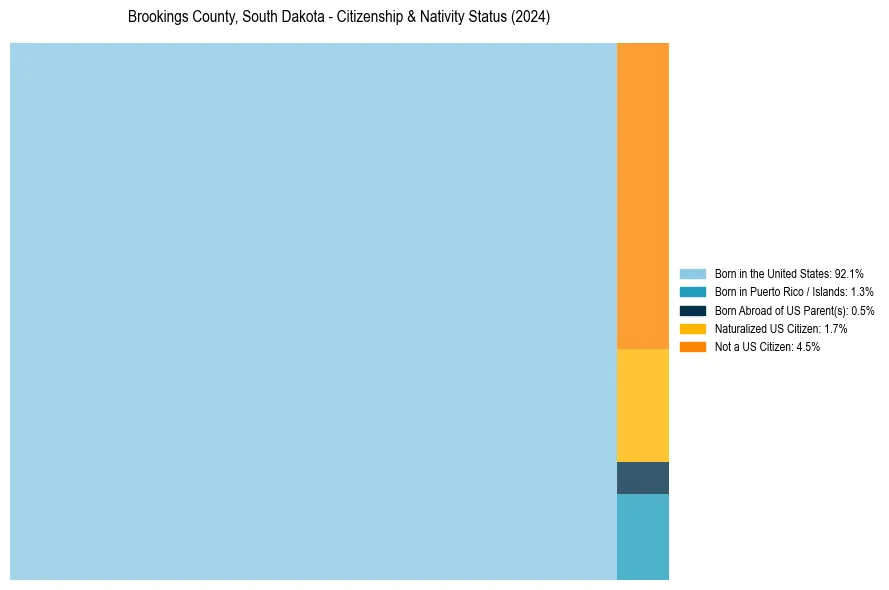
Brookings County, South Dakota Nativity & Citizenship Distribution
Brookings County, South Dakota Historical Nativity Trends (2010–2024)
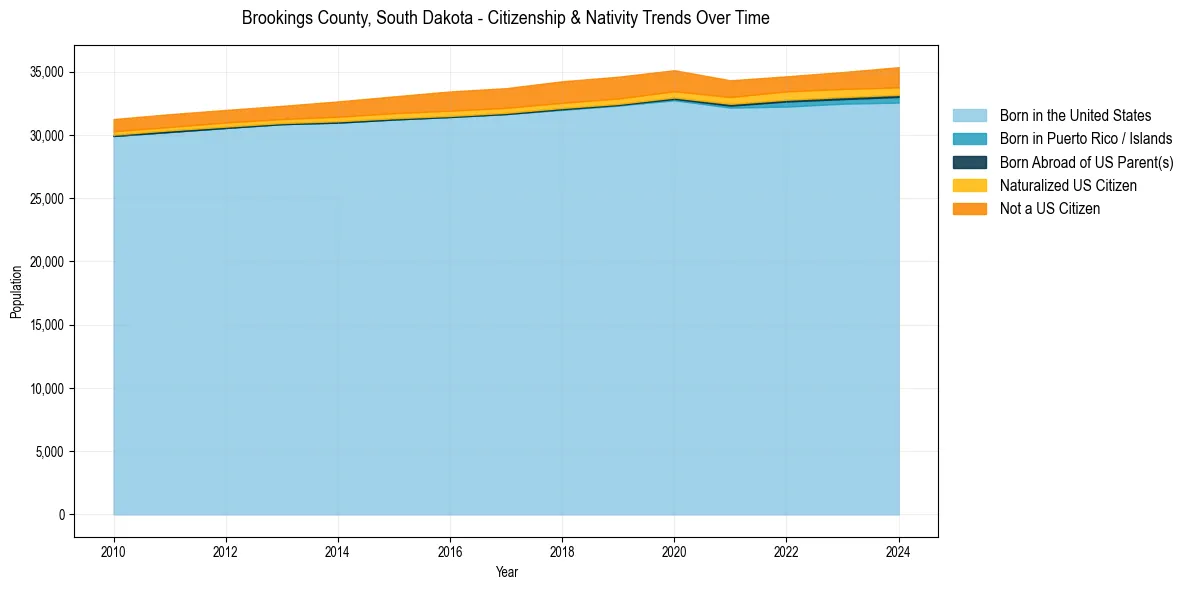
Brookings County, South Dakota Population & Nativity History
| Year | Total Pop | Foreign Born | Native Born |
|---|---|---|---|
| 2024 | 35,353 | 6.2% | 93.8% |
| 2023 | 34,968 | 5.7% | 94.3% |
| 2022 | 34,631 | 5.3% | 94.7% |
| 2021 | 34,315 | 5.4% | 94.6% |
| 2020 | 35,115 | 6.1% | 93.9% |
| 2019 | 34,601 | 6.2% | 93.8% |
| 2018 | 34,239 | 6.2% | 93.8% |
| 2017 | 33,697 | 5.8% | 94.2% |
| 2016 | 33,435 | 5.8% | 94.2% |
| 2015 | 33,046 | 5.2% | 94.8% |
| 2014 | 32,647 | 4.8% | 95.2% |
| 2013 | 32,295 | 4.2% | 95.8% |
| 2012 | 31,973 | 4.1% | 95.9% |
| 2011 | 31,639 | 4.0% | 96.0% |
| 2010 | 31,250 | 3.9% | 96.1% |
Nativity & Citizenship FAQs for Brookings County, South Dakota
Approximately 6.2% of residents in Brookings County, South Dakota were born outside the United States.
The vast majority of residents, roughly 95.5%, are U.S. citizens (including both native-born and naturalized citizens).