Spartanburg County, South Carolina Nativity & Citizenship Status (2024)
Place of birth and citizenship status analysis for Spartanburg County, South Carolina
Spartanburg County, South Carolina Nativity & Citizenship Indicators (2024)
Native Born
91.3%
Foreign Born
8.7%
Naturalized
4.2%
US Citizens
95.5%
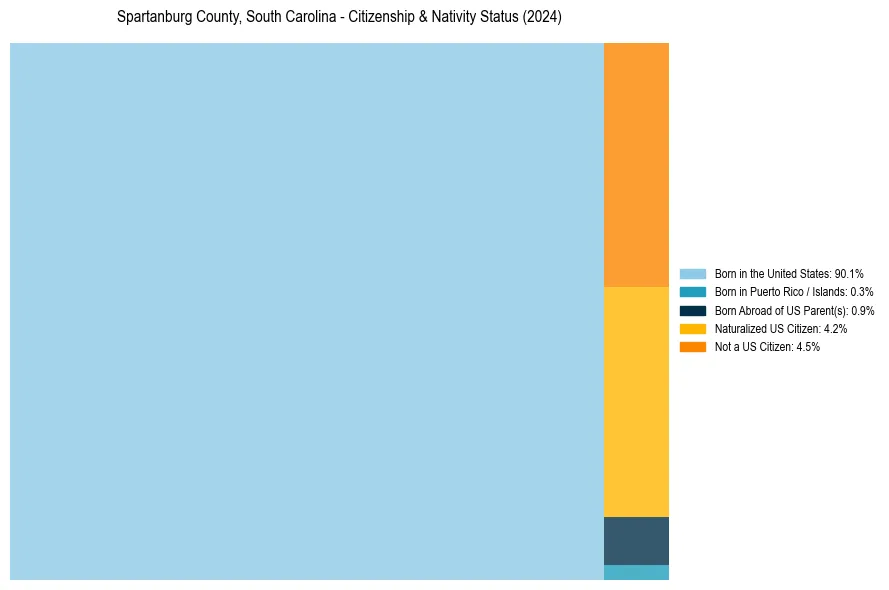
Spartanburg County, South Carolina Nativity & Citizenship Distribution
Spartanburg County, South Carolina Historical Nativity Trends (2010–2024)
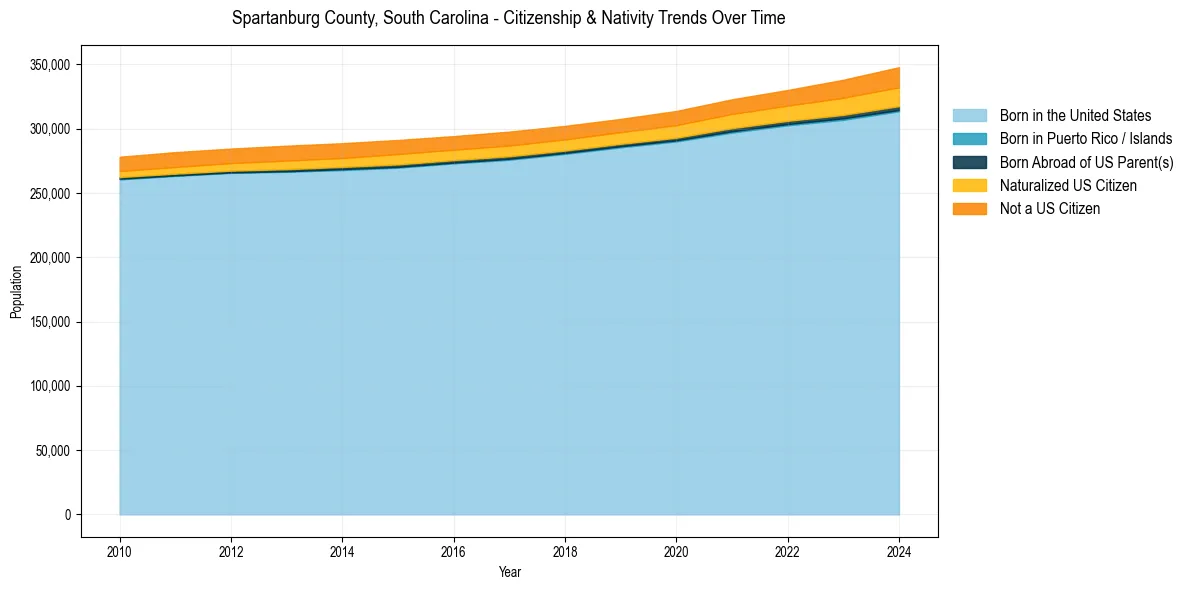
Spartanburg County, South Carolina Population & Nativity History
| Year | Total Pop | Foreign Born | Native Born |
|---|---|---|---|
| 2024 | 347,852 | 8.7% | 91.3% |
| 2023 | 338,096 | 8.1% | 91.9% |
| 2022 | 330,119 | 7.3% | 92.7% |
| 2021 | 322,864 | 7.0% | 93.0% |
| 2020 | 313,791 | 6.6% | 93.4% |
| 2019 | 307,617 | 6.3% | 93.7% |
| 2018 | 302,195 | 6.4% | 93.6% |
| 2017 | 297,732 | 6.4% | 93.6% |
| 2016 | 294,229 | 6.4% | 93.6% |
| 2015 | 291,240 | 6.5% | 93.5% |
| 2014 | 288,728 | 6.4% | 93.6% |
| 2013 | 286,789 | 6.4% | 93.6% |
| 2012 | 284,540 | 6.0% | 94.0% |
| 2011 | 281,777 | 5.9% | 94.1% |
| 2010 | 278,167 | 5.7% | 94.3% |
Nativity & Citizenship FAQs for Spartanburg County, South Carolina
Approximately 8.7% of residents in Spartanburg County, South Carolina were born outside the United States.
The vast majority of residents, roughly 95.5%, are U.S. citizens (including both native-born and naturalized citizens).