Saluda County, South Carolina Nativity & Citizenship Status (2024)
Place of birth and citizenship status analysis for Saluda County, South Carolina
Saluda County, South Carolina Nativity & Citizenship Indicators (2024)
Native Born
92.7%
Foreign Born
7.3%
Naturalized
1.5%
US Citizens
94.2%
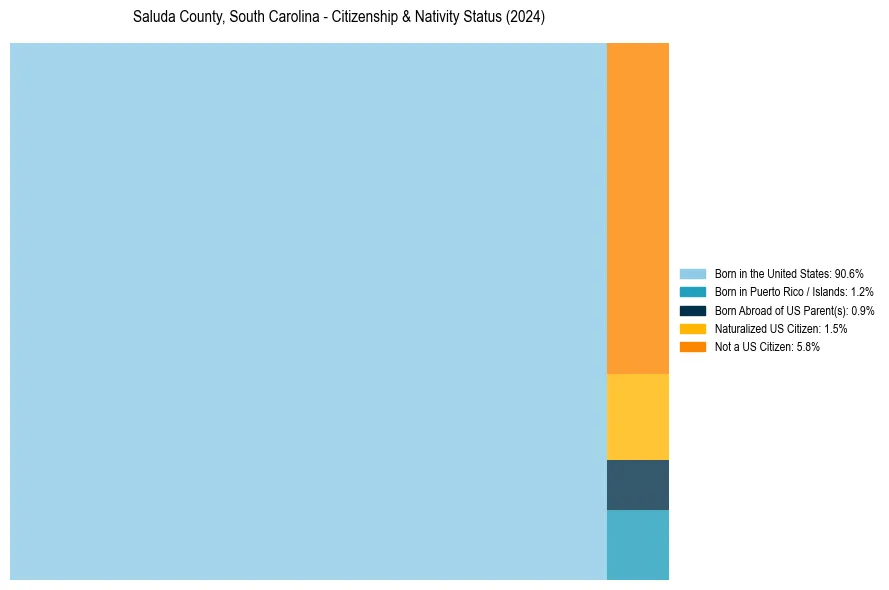
Saluda County, South Carolina Nativity & Citizenship Distribution
Saluda County, South Carolina Historical Nativity Trends (2010–2024)
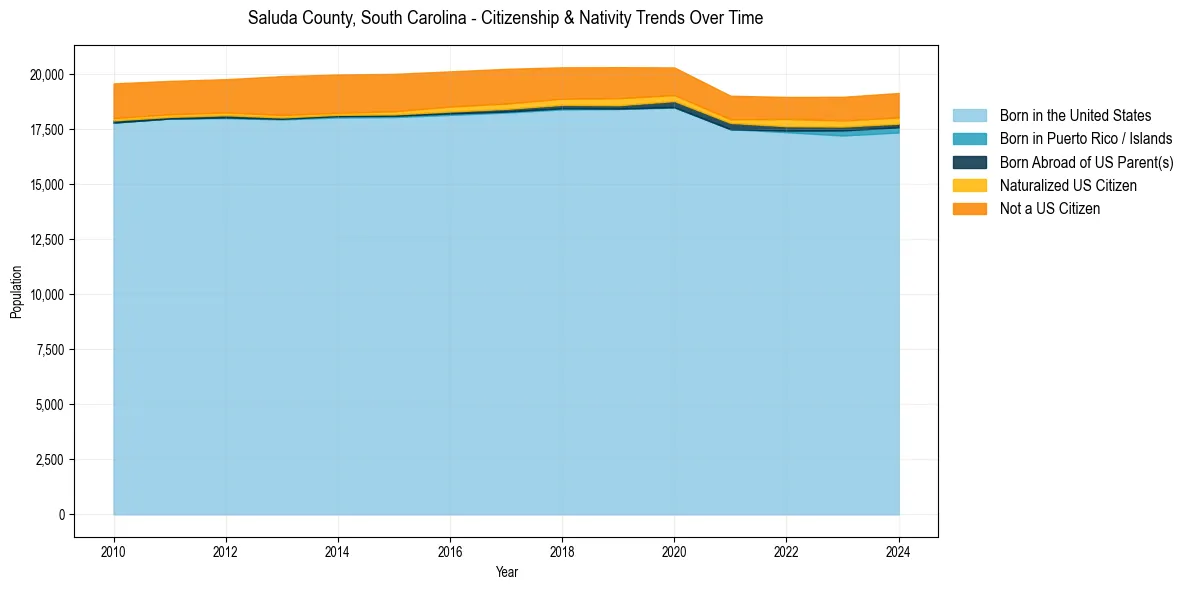
Saluda County, South Carolina Population & Nativity History
| Year | Total Pop | Foreign Born | Native Born |
|---|---|---|---|
| 2024 | 19,131 | 7.3% | 92.7% |
| 2023 | 18,958 | 7.1% | 92.9% |
| 2022 | 18,952 | 7.0% | 93.0% |
| 2021 | 19,008 | 6.5% | 93.5% |
| 2020 | 20,292 | 7.5% | 92.5% |
| 2019 | 20,303 | 8.5% | 91.5% |
| 2018 | 20,299 | 8.4% | 91.6% |
| 2017 | 20,228 | 9.0% | 91.0% |
| 2016 | 20,113 | 9.1% | 90.9% |
| 2015 | 20,000 | 9.2% | 90.8% |
| 2014 | 19,973 | 9.2% | 90.8% |
| 2013 | 19,895 | 9.4% | 90.6% |
| 2012 | 19,758 | 8.3% | 91.7% |
| 2011 | 19,681 | 8.3% | 91.7% |
| 2010 | 19,567 | 8.6% | 91.4% |
Nativity & Citizenship FAQs for Saluda County, South Carolina
Approximately 7.3% of residents in Saluda County, South Carolina were born outside the United States.
The vast majority of residents, roughly 94.2%, are U.S. citizens (including both native-born and naturalized citizens).