Richland County, South Carolina Nativity & Citizenship Status (2024)
Place of birth and citizenship status analysis for Richland County, South Carolina
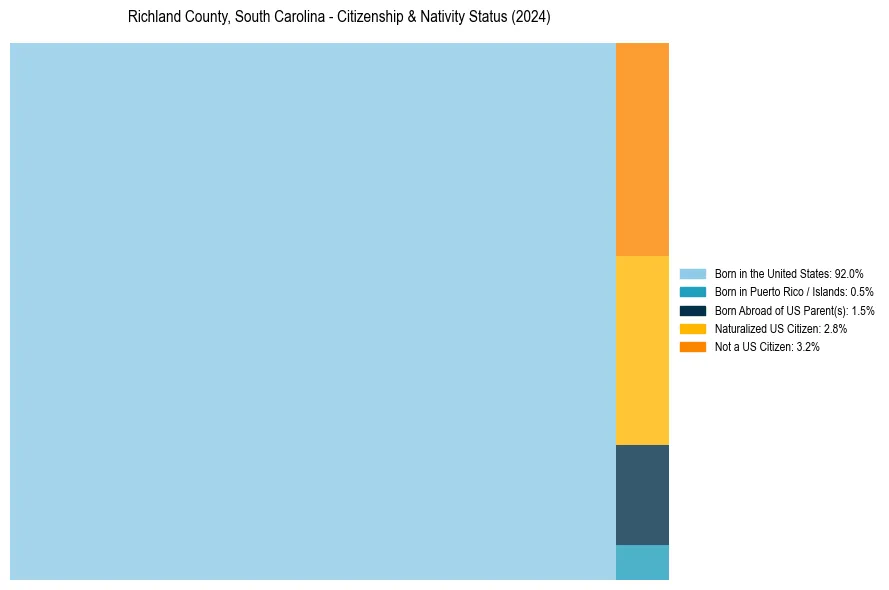
Richland County, South Carolina Nativity & Citizenship Indicators (2024)
Native Born
94.0%
Foreign Born
6.0%
Naturalized
2.8%
US Citizens
96.8%
Richland County, South Carolina Nativity & Citizenship Distribution
Richland County, South Carolina Historical Nativity Trends (2010–2024)
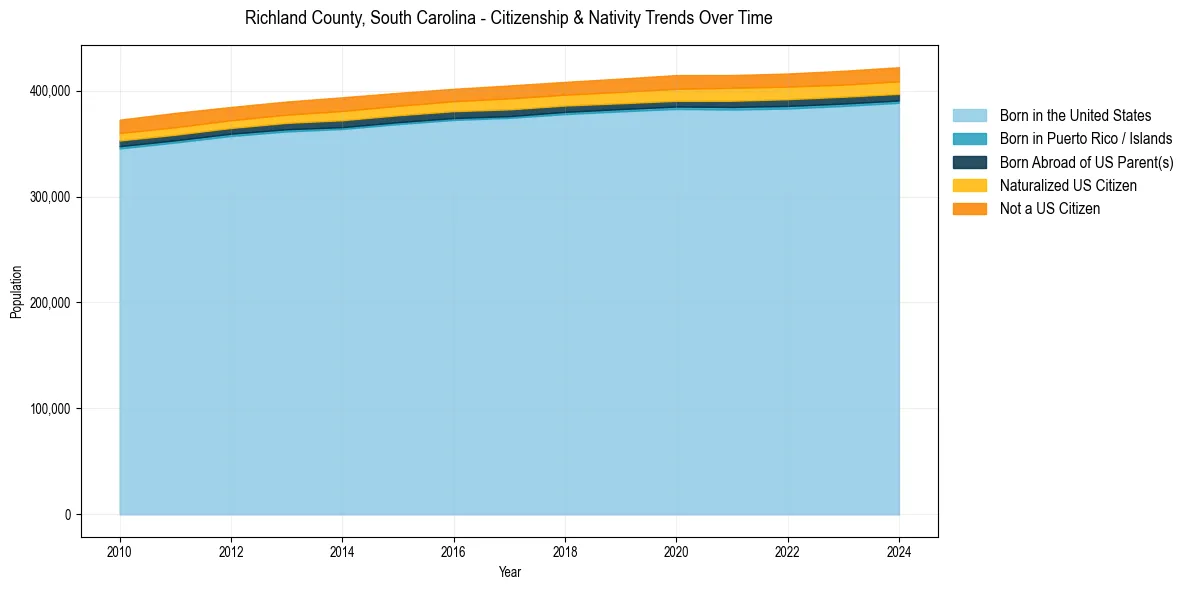
Richland County, South Carolina Population & Nativity History
| Year | Total Pop | Foreign Born | Native Born |
|---|---|---|---|
| 2024 | 422,117 | 6.0% | 94.0% |
| 2023 | 418,725 | 5.9% | 94.1% |
| 2022 | 416,161 | 5.8% | 94.2% |
| 2021 | 414,719 | 5.9% | 94.1% |
| 2020 | 414,660 | 5.9% | 94.1% |
| 2019 | 411,357 | 5.7% | 94.3% |
| 2018 | 408,263 | 5.5% | 94.5% |
| 2017 | 404,869 | 5.6% | 94.4% |
| 2016 | 401,743 | 5.3% | 94.7% |
| 2015 | 397,899 | 5.3% | 94.7% |
| 2014 | 393,707 | 5.5% | 94.5% |
| 2013 | 389,708 | 5.2% | 94.8% |
| 2012 | 384,596 | 5.2% | 94.8% |
| 2011 | 378,989 | 5.5% | 94.5% |
| 2010 | 372,597 | 5.3% | 94.7% |
Nativity & Citizenship FAQs for Richland County, South Carolina
Approximately 6.0% of residents in Richland County, South Carolina were born outside the United States.
The vast majority of residents, roughly 96.8%, are U.S. citizens (including both native-born and naturalized citizens).