Orangeburg County, South Carolina Nativity & Citizenship Status (2024)
Place of birth and citizenship status analysis for Orangeburg County, South Carolina
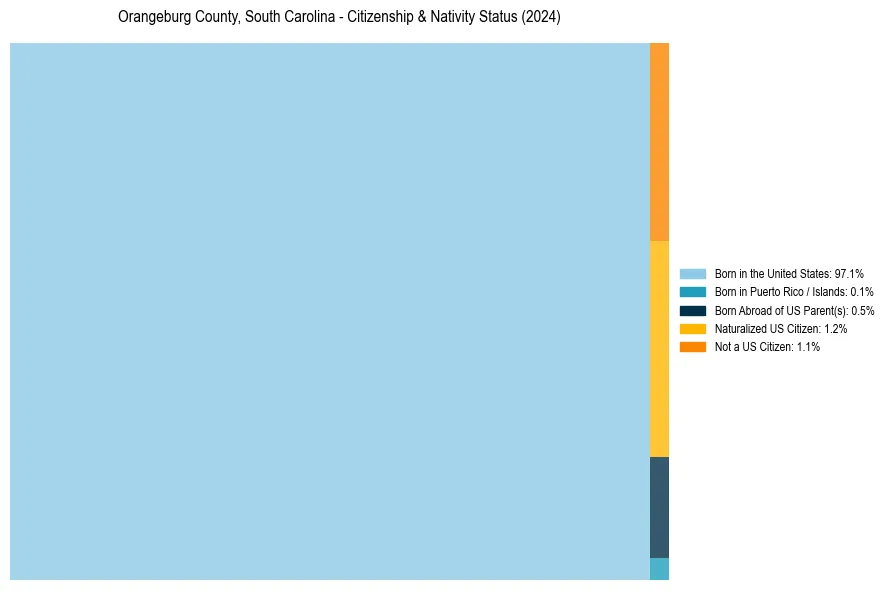
Orangeburg County, South Carolina Nativity & Citizenship Indicators (2024)
Native Born
97.8%
Foreign Born
2.2%
Naturalized
1.2%
US Citizens
98.9%
Orangeburg County, South Carolina Nativity & Citizenship Distribution
Orangeburg County, South Carolina Historical Nativity Trends (2010–2024)
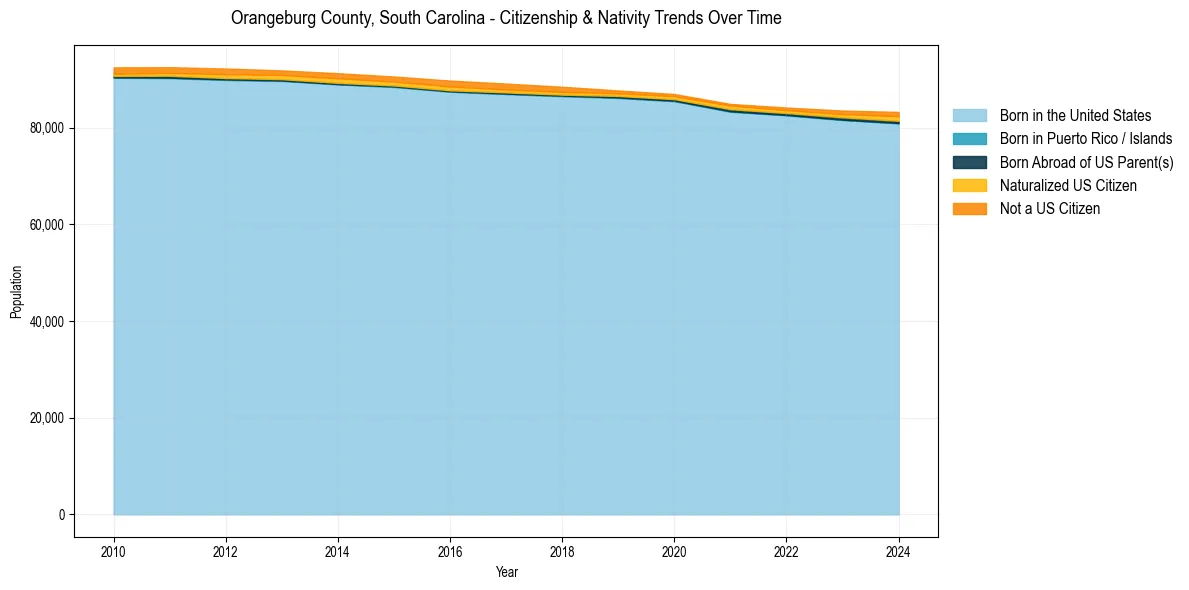
Orangeburg County, South Carolina Population & Nativity History
| Year | Total Pop | Foreign Born | Native Born |
|---|---|---|---|
| 2024 | 83,253 | 2.2% | 97.8% |
| 2023 | 83,531 | 1.7% | 98.3% |
| 2022 | 84,159 | 1.4% | 98.6% |
| 2021 | 84,909 | 1.3% | 98.7% |
| 2020 | 86,953 | 1.2% | 98.8% |
| 2019 | 87,687 | 1.3% | 98.7% |
| 2018 | 88,454 | 1.8% | 98.2% |
| 2017 | 89,116 | 2.1% | 97.9% |
| 2016 | 89,731 | 2.2% | 97.8% |
| 2015 | 90,575 | 2.1% | 97.9% |
| 2014 | 91,262 | 2.2% | 97.8% |
| 2013 | 91,836 | 2.0% | 98.0% |
| 2012 | 92,229 | 2.1% | 97.9% |
| 2011 | 92,503 | 1.9% | 98.1% |
| 2010 | 92,475 | 1.9% | 98.1% |
Nativity & Citizenship FAQs for Orangeburg County, South Carolina
Approximately 2.2% of residents in Orangeburg County, South Carolina were born outside the United States.
The vast majority of residents, roughly 98.9%, are U.S. citizens (including both native-born and naturalized citizens).