Oconee County, South Carolina Nativity & Citizenship Status (2024)
Place of birth and citizenship status analysis for Oconee County, South Carolina
Oconee County, South Carolina Nativity & Citizenship Indicators (2024)
Native Born
95.8%
Foreign Born
4.2%
Naturalized
1.7%
US Citizens
97.5%
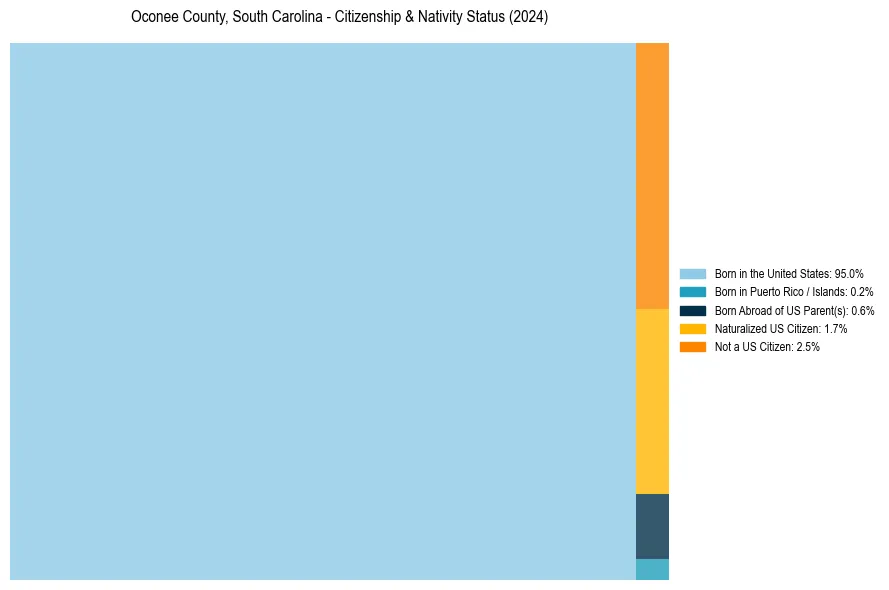
Oconee County, South Carolina Nativity & Citizenship Distribution
Oconee County, South Carolina Historical Nativity Trends (2010–2024)
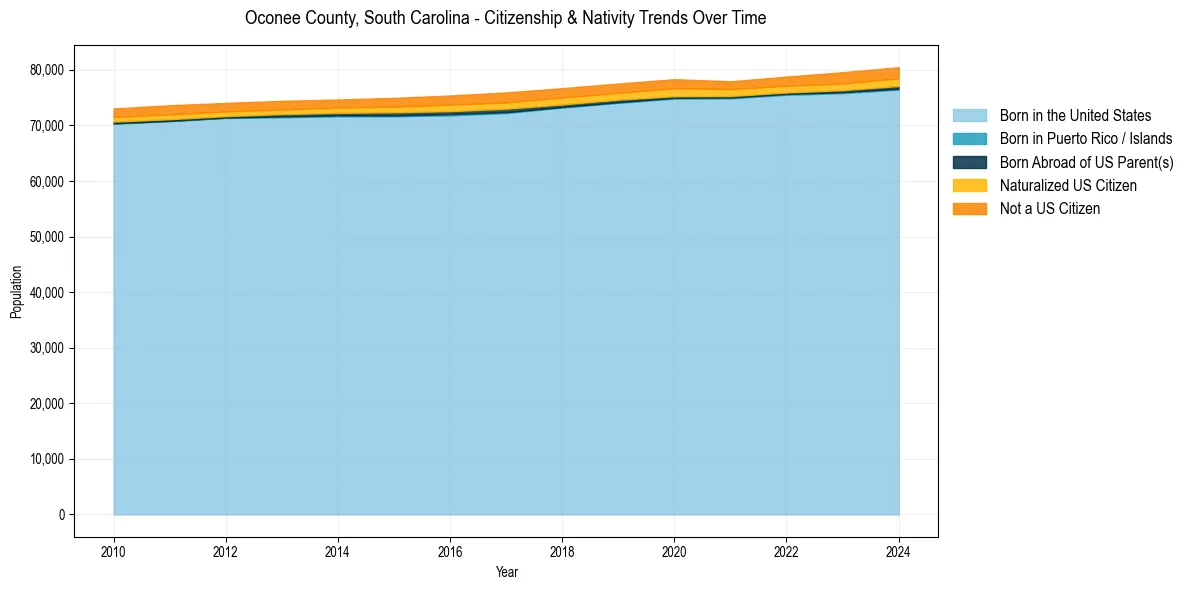
Oconee County, South Carolina Population & Nativity History
| Year | Total Pop | Foreign Born | Native Born |
|---|---|---|---|
| 2024 | 80,469 | 4.2% | 95.8% |
| 2023 | 79,566 | 4.1% | 95.9% |
| 2022 | 78,775 | 3.6% | 96.4% |
| 2021 | 77,932 | 3.4% | 96.6% |
| 2020 | 78,314 | 3.9% | 96.1% |
| 2019 | 77,528 | 3.8% | 96.2% |
| 2018 | 76,696 | 3.8% | 96.2% |
| 2017 | 75,926 | 3.9% | 96.1% |
| 2016 | 75,375 | 3.7% | 96.3% |
| 2015 | 74,949 | 3.5% | 96.5% |
| 2014 | 74,656 | 3.2% | 96.8% |
| 2013 | 74,419 | 3.2% | 96.8% |
| 2012 | 74,038 | 3.2% | 96.8% |
| 2011 | 73,629 | 3.4% | 96.6% |
| 2010 | 73,035 | 3.2% | 96.8% |
Nativity & Citizenship FAQs for Oconee County, South Carolina
Approximately 4.2% of residents in Oconee County, South Carolina were born outside the United States.
The vast majority of residents, roughly 97.5%, are U.S. citizens (including both native-born and naturalized citizens).