South Carolina Nativity & Citizenship Status (2024)
Place of birth and citizenship status analysis for South Carolina
South Carolina Nativity & Citizenship Indicators (2024)
Native Born
94.2%
Foreign Born
5.8%
Naturalized
2.6%
US Citizens
96.8%
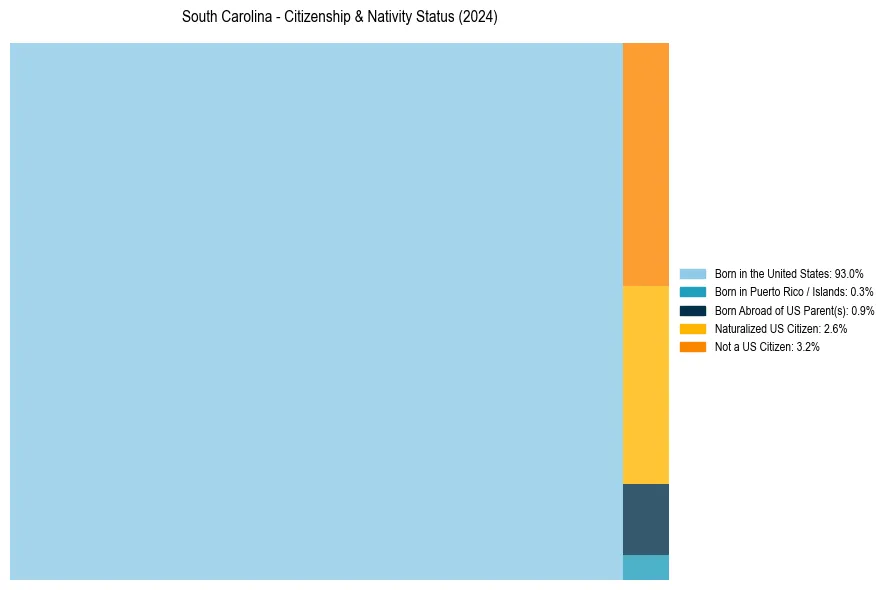
South Carolina Nativity & Citizenship Distribution
South Carolina Historical Nativity Trends (2010–2024)
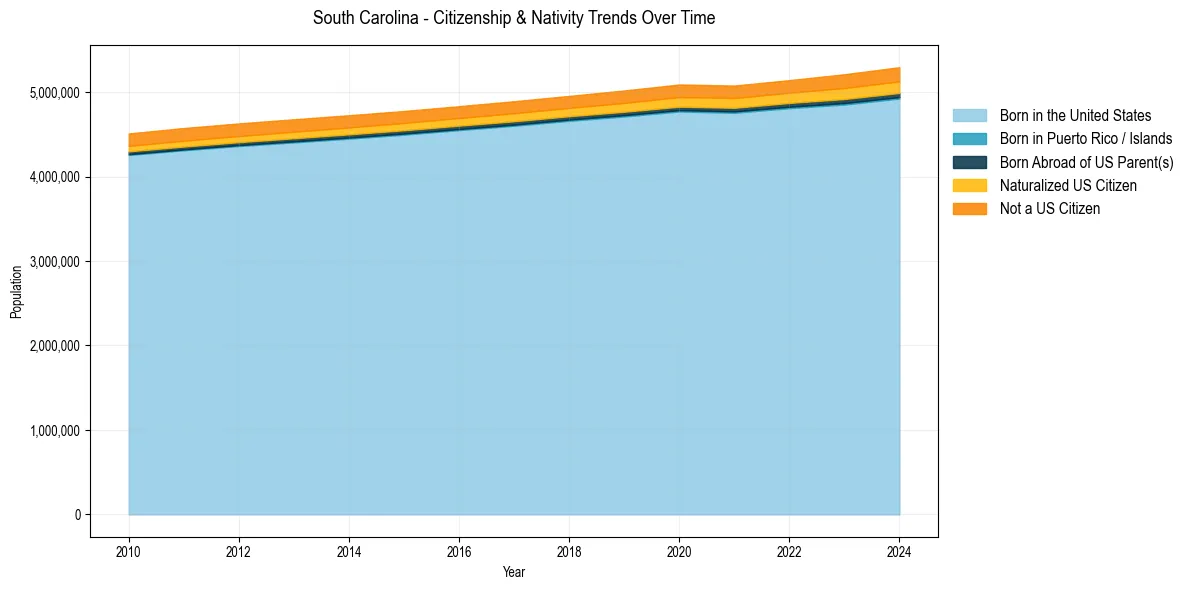
South Carolina Population & Nativity History
| Year | Total Pop | Foreign Born | Native Born |
|---|---|---|---|
| 2024 | 5,296,225 | 5.8% | 94.2% |
| 2023 | 5,212,774 | 5.6% | 94.4% |
| 2022 | 5,142,750 | 5.3% | 94.7% |
| 2021 | 5,078,903 | 5.2% | 94.8% |
| 2020 | 5,091,517 | 5.2% | 94.8% |
| 2019 | 5,020,806 | 5.0% | 95.0% |
| 2018 | 4,955,925 | 4.9% | 95.1% |
| 2017 | 4,893,444 | 4.9% | 95.1% |
| 2016 | 4,834,605 | 4.8% | 95.2% |
| 2015 | 4,777,576 | 4.8% | 95.2% |
| 2014 | 4,727,273 | 4.8% | 95.2% |
| 2013 | 4,679,602 | 4.8% | 95.2% |
| 2012 | 4,630,351 | 4.8% | 95.2% |
| 2011 | 4,575,864 | 4.8% | 95.2% |
| 2010 | 4,511,428 | 4.7% | 95.3% |
Nativity & Citizenship FAQs for South Carolina
Approximately 5.8% of residents in South Carolina were born outside the United States.
The vast majority of residents, roughly 96.8%, are U.S. citizens (including both native-born and naturalized citizens).